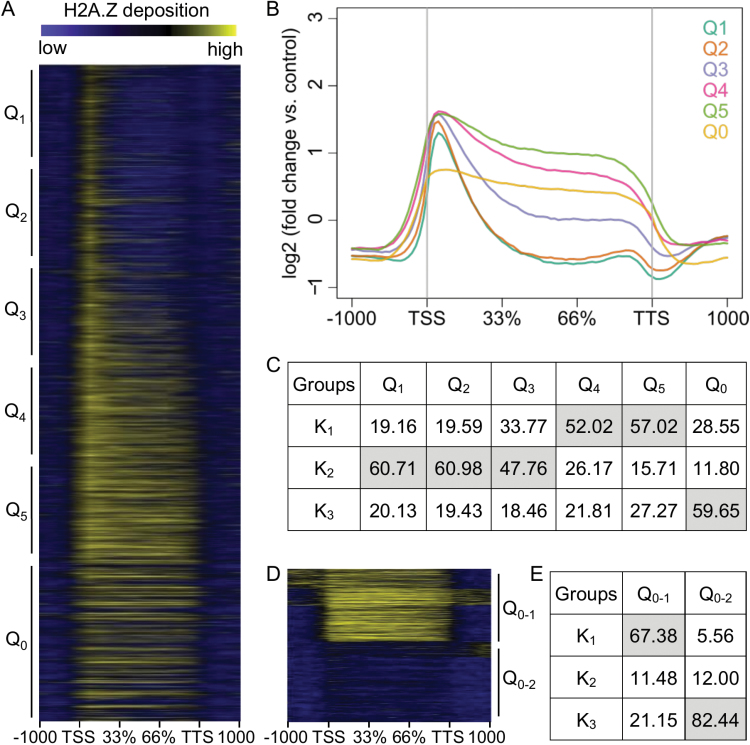
Fig. 1.
H2A.Z deposition is correlated with gene expression. (A) Heat map and (B) average profiles of H2A.Z deposition ranked according to expression in the wild-type under control conditions from 1000 bp upstream of the transcription start site (TSS) to 1000 bp downstream of the transcription termination site (TTS). Q1 is the highest expressed quintile and Q5 is the lowest expressed quintile. Q0 contains the genes with no expression (FPKM=0). (C) The correlation between quintiles with H2A.Z deposition patterns (k1–3). The numbers represent the normalized distribution of genes in each pattern. (D) Two distinct patterns of H2A.Z deposition for genes with no expression and (E) their correlation with H2A.Z deposition patterns (k1–3).

