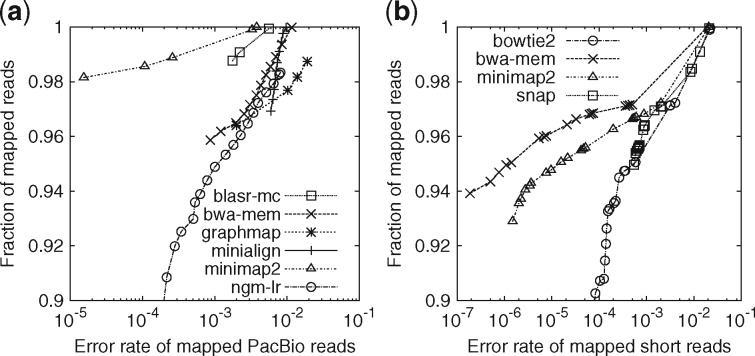
Fig. 1.
Evaluation on aligning simulated reads. Simulated reads were mapped to the primary assembly of human genome GRCh38. A read is considered correctly mapped if its longest alignment overlaps with the true interval, and the overlap length is ≥10% of the true interval length. Read alignments are sorted by mapping quality in the descending order. For each mapping quality threshold, the fraction of alignments (out of the number of input reads) with mapping quality above the threshold and their error rate are plotted along the curve. (a) Long-read alignment evaluation. 33 088 ≥1000 bp reads were simulated using pbsim (Ono et al., 2013) with error profile sampled from file ‘m131017_060208_42213_*.1.*’ downloaded at http://bit.ly/chm1p5c3. The N50 read length is 11 628. Aligners were run under the default setting for SMRT reads. Kart outputted all alignments at mapping quality 60, so is not shown in the figure. It mapped nearly all reads with 4.1% of alignments being wrong, less accurate than others. (b) Short-read alignment evaluation. 10 million pairs of 150 bp reads were simulated using mason2 (Holtgrewe, 2010) with option ‘–illumina-prob-mismatch-scale 2.5’. Short-read aligners were run under the default setting except for changing the maximum fragment length to 800 bp

