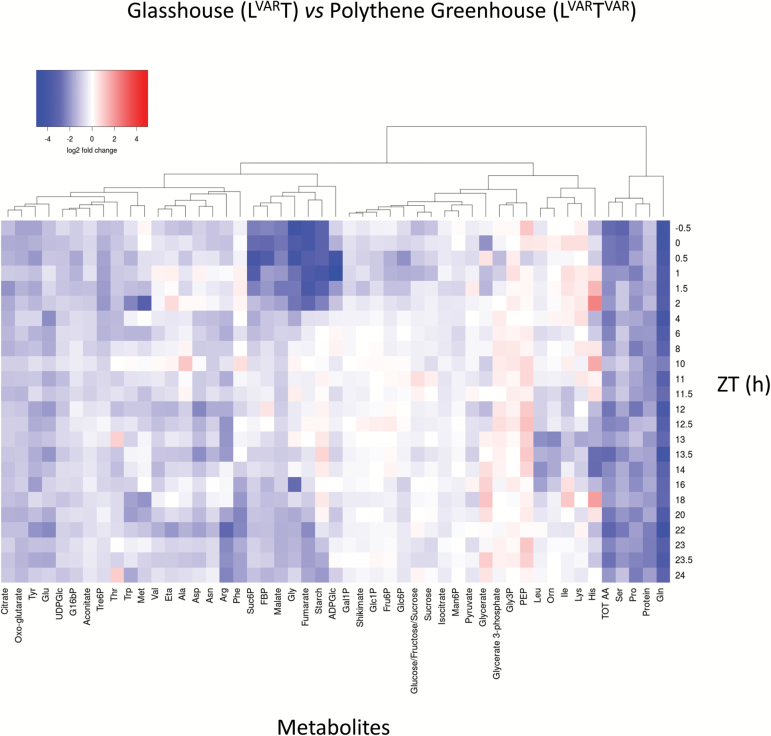
Fig. 3.
Log2 fold changes of the relative metabolic content are presented as a heat map of glasshouse (LVART) versus polythene greenhouse (LVARTVAR). Data are clustered based on hierarchical agglomerative clustering with complete linkage. Colour key: low values, blue; high values, red. FBP, fructose 1,6-bisphosphate; Eta, ethanolamine; Orn, ornithine.

