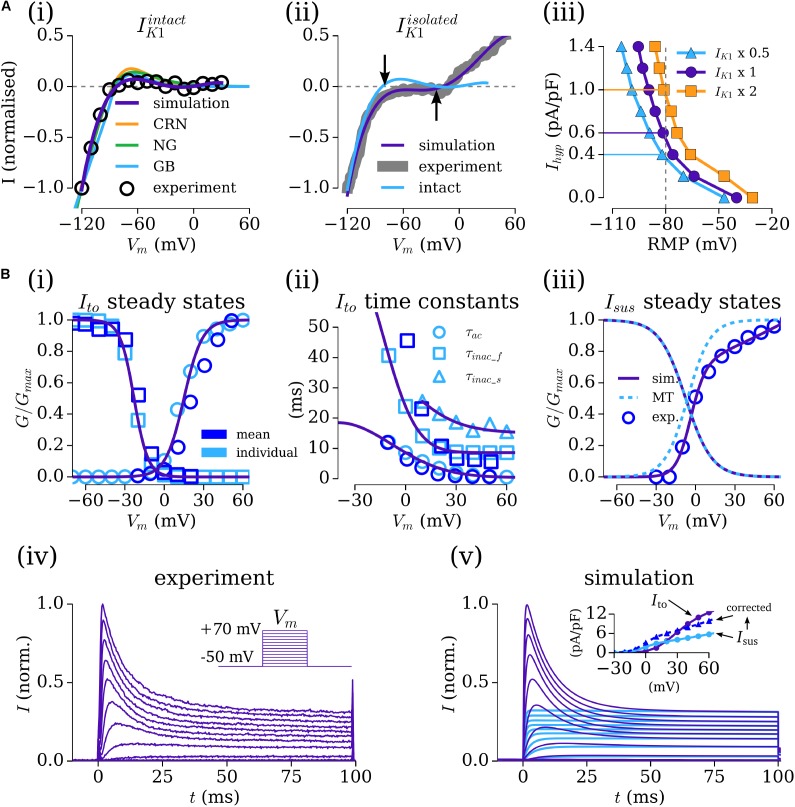
FIGURE 1.
Fitting the Workman-lab K+ characterized currents. (A) Fitting IK1 and the hyperpolarizing current (Ihyp). (i) IK1 measured in the WL_2012_IK1 study (Marshall et al., 2012), considered “intact” (black circles) and simulation fits from the new formulations (purple) and the three human atrial models [orange – CRN(Courtemanche et al., 1998); green – NG (Nygren et al., 1998); blue – GB (Grandi et al., 2011)]. (ii) IK1 measured in the WL_2006 (Workman et al., 2006) study, considered “isolated” (gray) and model fit (purple). The form of the “intact” current is shown for reference, with arrows indicating the difference in reversal between the intact and isolated variants. (iii) Relationship between resting membrane Potential (RMP) and Ihyp at three different amplitudes of IK1isolated (baseline – closed circles, purple; IK1 × 2 – closed squares, orange; IK1 × 0.5 – closed triangles, blue). (B,i–iii) Fitting of the gating variable parameters for Ito and Isus to the voltage-clamp data of WL_2012_ITO (Workman et al., 2012) (iv) and resulting simulated current traces (v) and IV relationship (inset). Open, light blue symbols refer to values calculated from fitting to individual current traces. Open, dark blue symbols refer to mean current data from WL_2012_ITO (Workman et al., 2012). The formulation from Maleckar et al. (2009) is shown for reference in panel iii. In the inset for panel iv, Ito is shown in purple, Isus in light blue, and corrected Isus in dark blue. Figure created using data from: Workman et al. (2006, 2012) and Marshall et al. (2012).

