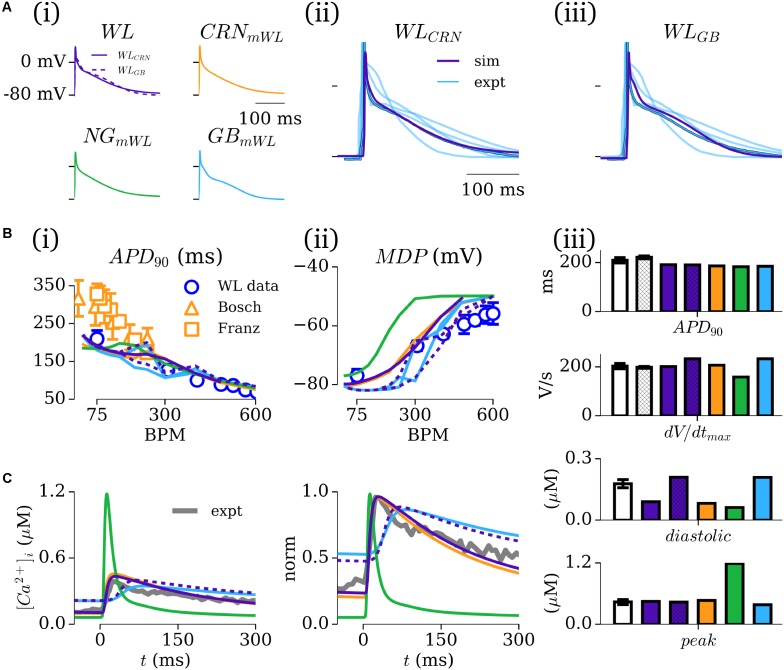
FIGURE 4.
Simulated AP and CaT characteristics and validation. (A,i) Action potential (AP) traces associated with the five novel model variants, paced at 75 BPM; (A,ii,iii) Comparison between the WL models (purple) and available experimental traces (blue; Workman et al., 2001, 2006, 2012; Pau et al., 2007 + Kettlewell unpublished Ca2+ data), with the “typical” Workman laboratory trace emphasized. (B,i) APD90 restitution for the five models [colored lines – colors correspond to those in A(i)] compared to experimental data from the Workman laboratory (blue circles; WL_2001; Workman et al., 2001) as well as from other groups for additional context [orange triangles (Bosch et al., 1999); orange squares (Franz et al., 1997)]. (B,ii) Rate dependence of MDP in the five models and Workman laboratory data (WL_2001). (B,iii) Comparison of APD90 and dv/dtmax at 75 BPM in the five models (colors; purple hatched bars corresponds to WLGB) and experiment (white: WL_2001, open bars; WL_2006, hatched bars). (C) Intracellular calcium transients in the five model variants (colored lines) and single experimental trace from the Workman laboratory (black; unpublished Sarah Kettlewell WL data), shown on absolute (i) and normalized (ii) scales. (iii) Comparison of the diastolic and peak calcium in the five models with mean data (n = 24 cells, 5 patients) from the Workman laboratory Kettlewell experiments. Figure created using data from Franz et al. (1997), Bosch et al. (1999), Workman et al. (2001, 2006, 2012) and Pau et al. (2007).

