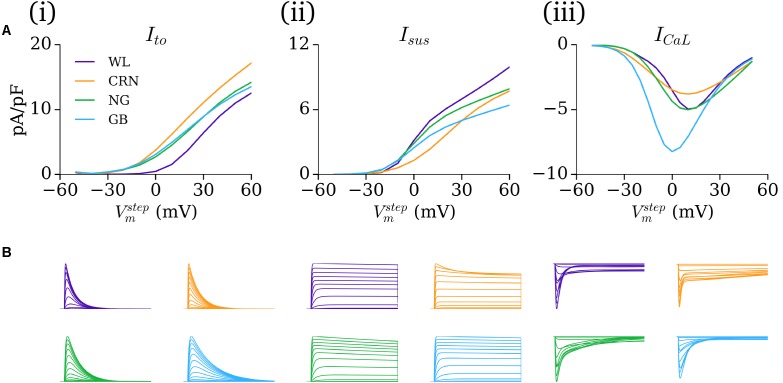
FIGURE 8.
Comparison of currents under voltage clamp. (A) Current–voltage (IV) curves and (B) Current traces associated with voltage clamp protocols for Ito (i), Isus (ii), and ICaL (iii) comparing the WL formulations (purple) with those originally presented in the CRN (orange), NG (green), and GB (blue) studies. All current traces are normalized, and presented on the same temporal scale for comparison.

