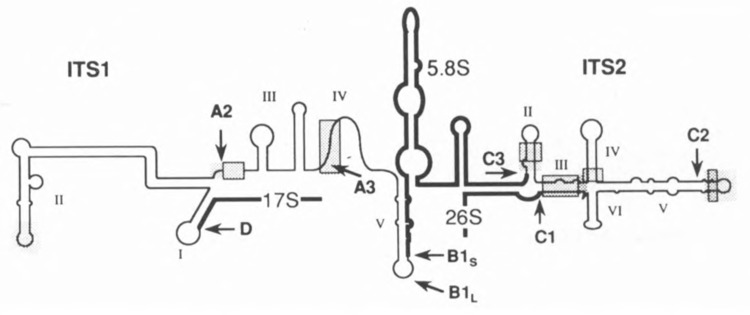
FIG. 2.

Schematic representation of the structure of the ITS1-5.8S-ITS2 region in the yeast 37S pre-rRNA (Yeh and Lee, 1991; Van Nues et al., 1993). Mature and spacer sequences are represented by bold and thin lines, respectively. Processing sites (cf. Fig. 1) are indicated by arrows. Highly conserved regions are indicated by shading and essential exacting processing elements so far identified are blocked.
