FIGURE 1.
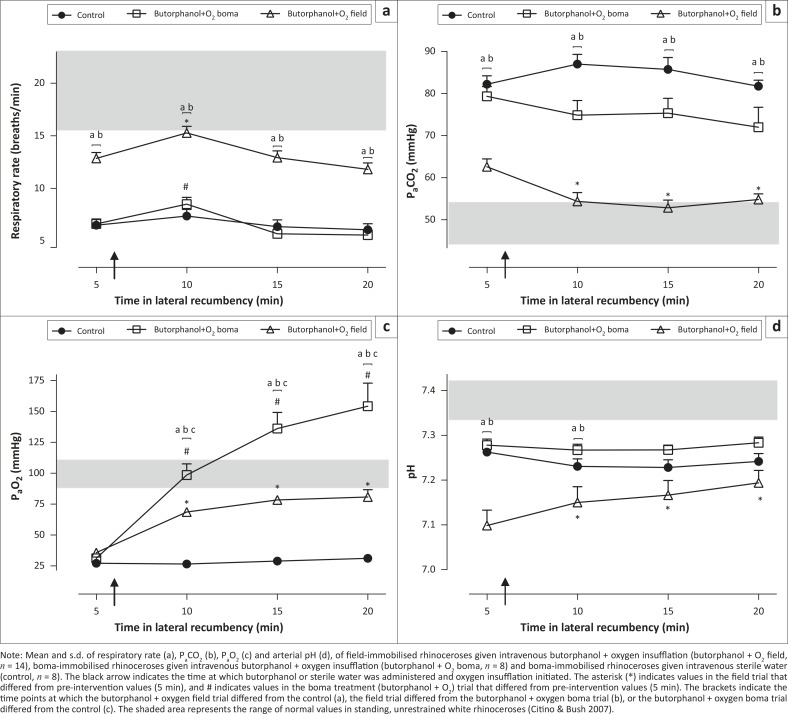
(a) Respiratory rate, (b) PaCO2, (c) PaO2 and (d) pH.
Note: Mean and s.d. of respiratory rate (a), PaCO2 (b), PaO2 (c) and arterial pH (d), of field-immobilised rhinoceroses given intravenous butorphanol + oxygen insufflation (butorphanol + O2 field, n = 14), boma-immobilised rhinoceroses given intravenous butorphanol + oxygen insufflation (butorphanol + O2 boma, n = 8) and boma-immobilised rhinoceroses given intravenous sterile water (control, n = 8). The black arrow indicates the time at which butorphanol or sterile water was administered and oxygen insufflation initiated. The asterisk (*) indicates values in the field trial that differed from pre-intervention values (5 min), and # indicates values in the boma treatment (butorphanol + O2) trial that differed from pre-intervention values (5 min). The brackets indicate the time points at which the butorphanol + oxygen field trial differed from the control (a), the field trial differed from the butorphanol + oxygen boma trial (b), or the butorphanol + oxygen boma trial differed from the control (c). The shaded area represents the range of normal values in standing, unrestrained white rhinoceroses (Citino & Bush 2007).

