
Figure 4. Vestibular stimulation transiently alters fusiform cell sensitivity to spectral notches.
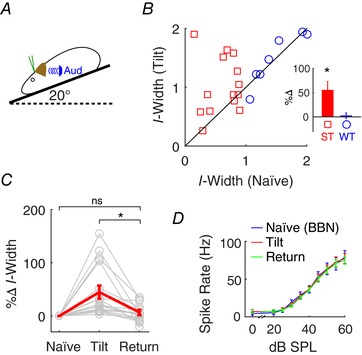
A, vestibular stimulation was applied during a 20° pitch tilt (left panel). B, fusiform cell (n = 24) notch responses were accessed before (naïve at 0°; horizontal axis of right panel) and during tilt stimulation (vertical axis). Data points near the diagonal line represent minimal change during tilt stimulation, while those away from the diagonal in either direction indicate increases or decreases in I‐width during tilt stimulation. ST and WT units were distinguished by their naïve I‐width. Inset: data plotted as percent changes in I‐width. C, changes in I‐width from naïve to 20° tilt, and immediately after return to the 0° (return). D, rate‐level functions to BBN at each condition were recorded as controls. * P < 0.05 (post hoc).