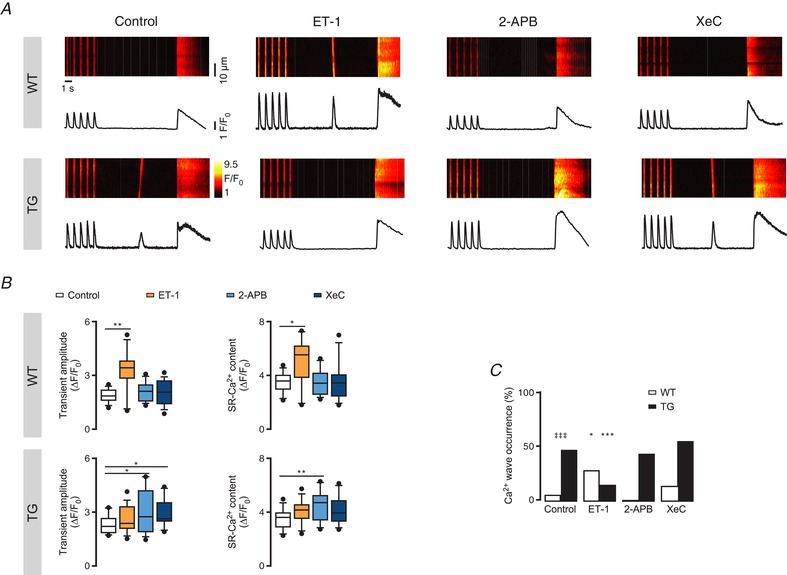
Figure 2. IP3R2 activation alters Ca2+ wave occurrence in intact cardiomyocytes.

A, representative line‐scans of fluo‐3‐loaded intact cardiomyocytes with the corresponding fluorescence profiles upon pharmacological intervention with 100 nM ET‐1, 2 μM 2‐APB or 3 μM XeC. Cells were field stimulated for 30 s at 1 Hz to reach steady state prior to a 10 s rest period to assess Ca2+ wave occurrence as a measure for arrhythmogenicity at the single cell level. SR‐Ca2+ load was assessed by application of 10 mM caffeine. B, Ca2+ transient amplitude (ΔF/F 0) and SR‐Ca2+ content (ΔF/F 0) under the tested pharmacological interventions in WT (n of groups 1–4 = 13, 11, 16, 15; N of groups 1–4 = 4, 3, 3, 3) and TG myocytes (n of groups 1–4 = 14, 16, 14, 11; N of groups 1–4 = 4, 4, 3, 3; * P < 0.05, ** P < 0.01 vs. control; ANOVA followed by Dunnett's test). C, Ca2+ wave occurrence (%) calculated as the portion of cardiomyocytes displaying Ca2+ waves within the 10 s rest period (* P < 0.05, *** P < 0.001 vs. control; ‡‡‡ P < 0.001 vs. WT; N = 3–4, n = 9–21; χ2 test).
