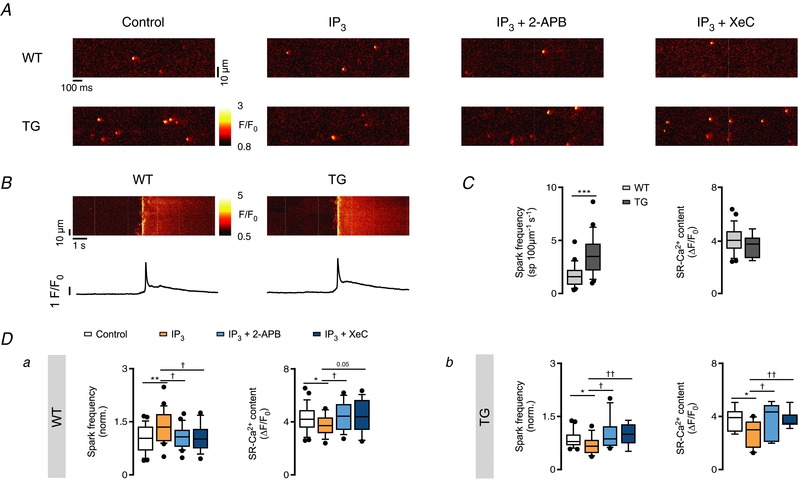
Figure 5. IP3 evokes a divergent response in CaSpF in WT and TG permeabilized myocytes.

A, representative line‐scan images of Ca2+ events in permeabilized cardiomyocytes in control conditions and in the presence of 10 μM IP3‐salt and/or 2 μM 2‐APB, 3 μM XeC in WT and TG. After permeabilization and plating, each cell was scanned before and 2–4 min after pharmacological intervention. B, representative line‐scan images with the corresponding fluorescence profiles of de‐skewed caffeine (20 mM)‐induced Ca2+ transients under control conditions in WT and TG permeabilized myocytes. C, Ca2+ spark frequency (Ca2+ sparks (100 μm)−1 s−1) and SR‐Ca2+ content (ΔF/F 0) in control conditions in WT and TG cells (*** P < 0.001 vs. WT; n = 25 each, N = 8 each; Student's t test). D, normalized Ca2+ spark frequencies (norm.) and SR‐Ca2+ content (20 mM caffeine, ΔF/F 0) after Ca2+ event occurrence assessment in control conditions and in the presence of IP3‐salt and/or 2‐APB, XeC in WT (n of groups 1–4 = 25, 22, 20, 16; N of groups 1–4 = 8, 8, 3, 3) and TG myocytes (n of groups 1–4 = 25, 13, 11, 10; N of groups 1–4 = 8, 3, 3, 3; * P < 0.05, ** P < 0.01 vs. control; † P < 0.05, †† P < 0.01 vs. IP3; ANOVA followed by Dunnett's test).
