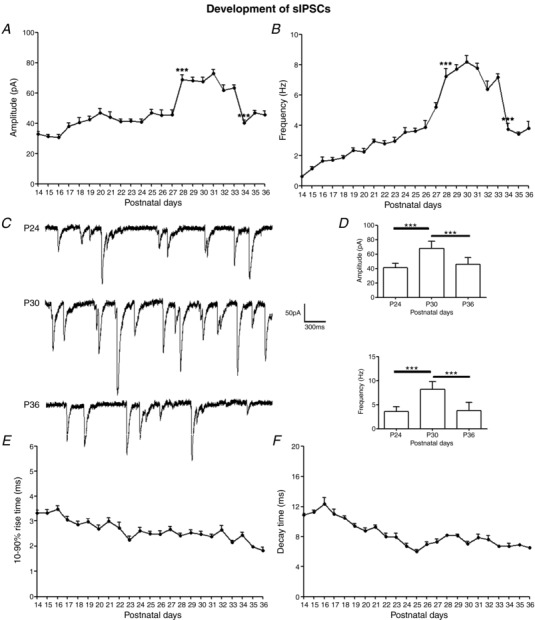
Figure 2. Development of sIPSCs in the rat visual cortex.

A and B, mean amplitudes and frequencies of sIPSCs in layer V pyramidal neurons daily from P14 to P36. Both parameters increased significantly at P28 (P < 0.001 for both) and stayed high until falling abruptly at P34 (P < 0.001 for both). N ≥ 15 from at least two litters for each time point tested. C, sample traces of sIPSCs recorded at P24, P30 and P36. D, histograms and comparisons of mean ± SEM amplitudes and frequencies of sIPSCs at P24, P30 and P36. Pairwise comparisons reaching significance are indicated with asterisks. For amplitudes, P24 vs. P30: *** P < 0.001; P30 vs. P36: *** P < 0.001. For frequencies, P24 vs. P30: *** P < 0.001; P30 vs. P36: *** P < 0.001. E, 10–90% rise time of sIPSCs (mean ± SEM) with age. F, decay time of sIPSCs (mean ± SEM) with age. Both rise time and decay time accelerated with age (P14 vs. P36: P < 0.001 for both).
