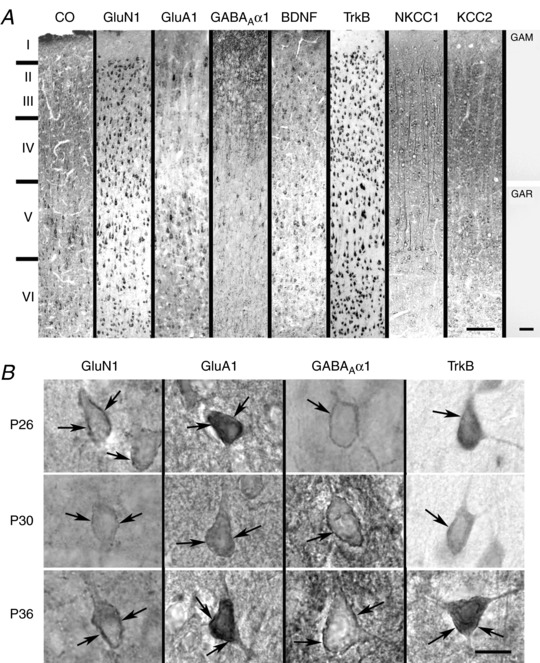
Figure 5. Neurochemical expression in the rat visual cortex.

A, sample low magnification images of the primary visual cortex reacted histochemically for cytochrome oxidase (CO) and immunohistochemically for GluN1, GluA1, GABAARα1, BDNF, TrkB, NKCC1 and KCC2 at P26. Cortical layers are indicated on the left. Far right: two controls without primary antibodies but with secondary antibodies only: GAM, goat‐anti‐mouse; GAR, goat‐anti‐rabbit secondary antibodies. B, higher magnification images of membrane labelling (arrows) of GluN1, GluA1, GABAARα1 and TrkB in layer V pyramidal neurons at P26, P30 and P36. Scale bars in (A): 100 μm; in (B): 10 μm.
