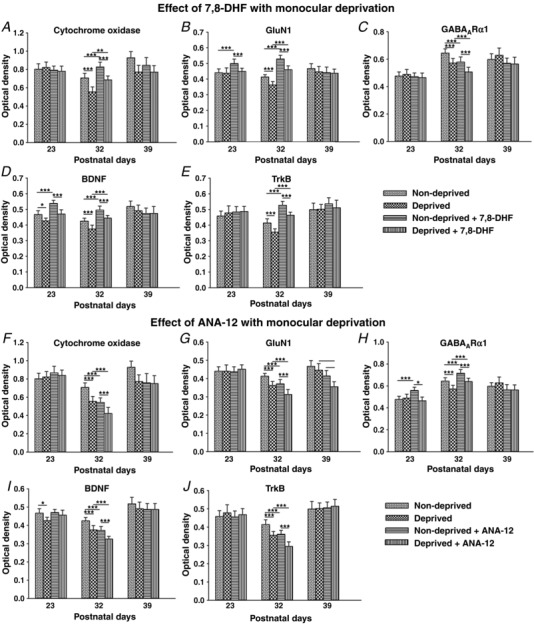
Figure 12. Effect of MD on neurochemical expression without or with in vivo 7,8‐DHF or ANA‐12.

Optical densitometric measurements of reaction product of CO (A and F) and immunoreaction product of GluN1 (B and G), GABAARα1 (C and H), BDNF (D and I) and TrkB (E and J) in single, non‐deprived and deprived layer V neurons are shown for the three time points (P23, P32 and P39) after 4 days of MD without or with in vivo 7,8‐DHF or ANA‐12. Comparisons that have reached statistical significance are indicated by asterisks. Changes were most striking at P32. All *** P < 0.001. A, ** P = 0.006 for D vs. D + DHF. B, ** P = 0.005 for ND vs. ND + DHF at P23; ** P = 0.004 for ND + DHF vs. D + ANA at P23. D, * P = 0.023 for ND vs. D at P23. G, * P = 0.016 for D vs. D + ANA at P39; ** P = 0.003 for ND + ANA vs. D + ANA at P39. H, * P = 0.017 for ND + ANA vs. D + ANA. I, * P = 0.023. N = 150 neurons from at least two litters for each bar shown (i.e. for each animal group at each time point and for each neurochemical tested).
