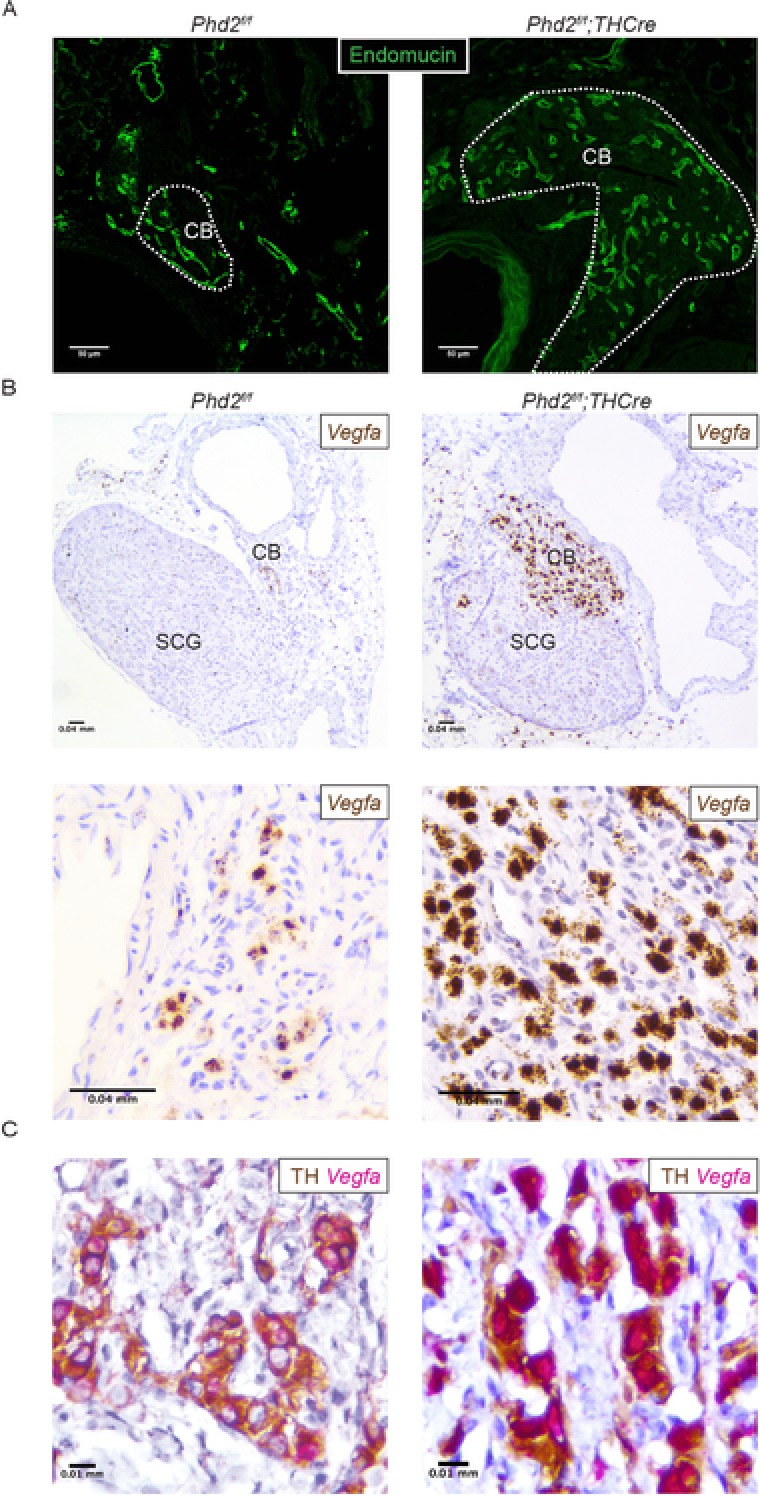
Figure 6. The effect of Type I cell‐specific PHD2 inactivation upon CB vasculature.

Representative images of CB tissues from Phd2f/f;THCre and Phd2f/f littermate controls. A, endomucin immunostaining (green, CB edges outlined in white). B, representative images of Vegfa mRNA (brown) in situ hybridization in the CB; low power images (upper) show both the CB and the superior cervical ganglion (SCG); high power images (lower) of the CB. C, Vegfa mRNA (pink) in situ hybridization combined with TH immunohistochemistry (brown).
