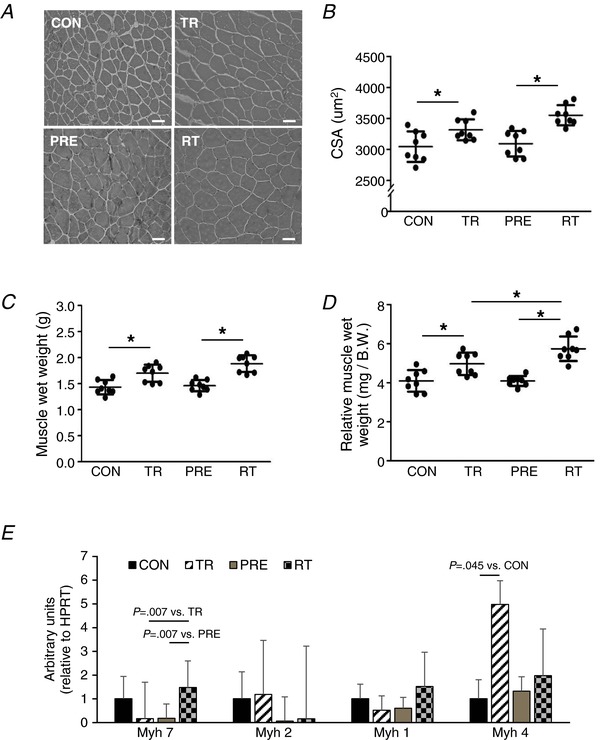
Figure 3. Muscle mass and muscle fibre typing.

A, myofibres in FHL muscle were visualized by H&E staining. B, CSA of myofibres and (C and D) muscle wet weights with or without normalization to body weight were quantified (n = 8). E, mRNA expression of myosin heavy chain (Myh) isoforms (n = 4). Scale bar = 50 μm. 1:200 magnification. Data are the mean ± SD. * P < 0.05. [Color figure can be viewed at http://wileyonlinelibrary.com]
