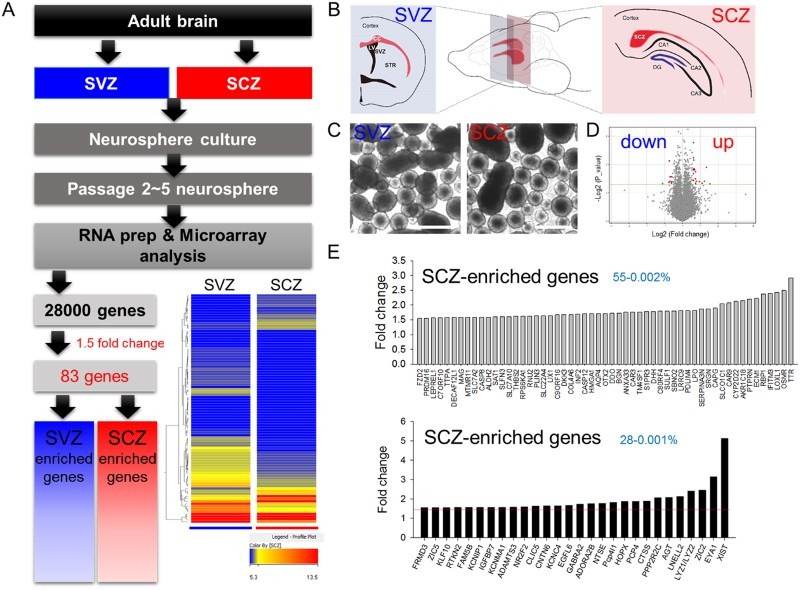
Figure 1.

Microarray analysis of neurospheres from the SCZ and SVZ. (A) Experimental scheme for microarray analysis. Among 28,000 genes from the array chip, 83 displayed changes ≥1.5 fold. Hierarchical entry tree is shown at the bottom left. (B) Adult brain SCZ and SVZ were cultured in vitro as neurospheres. (C) Passage 2–5 neurospheres were gathered and used for microarray analysis. (D) A Volcano plot. The red dot denotes genes with 1.5-fold changes. (E) The list of SVZ-enriched or SCZ-enriched genes. The red line denotes 1.5-fold changes. Fifty-five and 28 genes were selected as SVZ- and SCZ-enriched genes, respectively.
