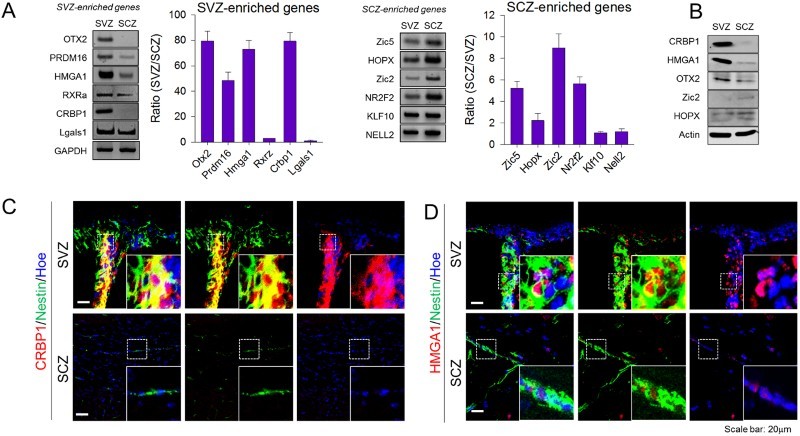
Figure 2.

Confirmation of microarray analysis. (A) Confirmation of gene expression according to microarray data using RT-PCR. SVZ- or SCZ-enriched genes were selected randomly, and bar graphs show the ratio of mRNA expression difference between two aNSCs populations upon normalization with GAPDH (N = 4). (B) Gene candidates were selected and confirmed by Western blot (N = 2), and representative images were shown. (C) CRBP1 and (D) HMGA1 proteins were immunostained with Nestin, a marker for NSCs, in the SVZ and SCZ, respectively. Magnified image of the box region is shown as an inset. Hoechest33343 was used as a nuclear marker.
