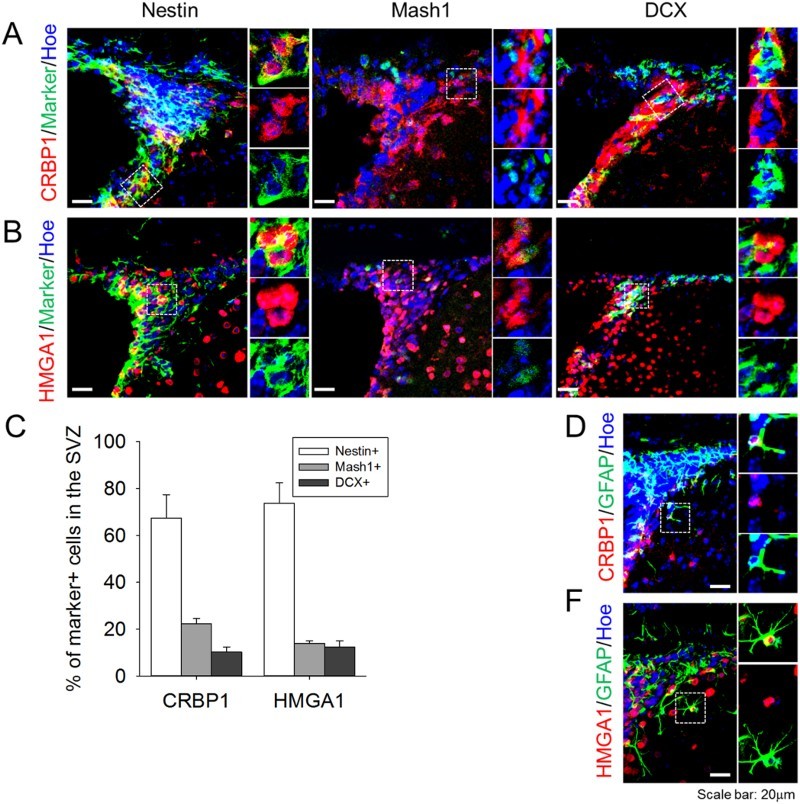
Figure 3.

Expression profile of CBRP1 and HMGA1 in the SVZ. (A,B) CRBP1 and HMGA1 proteins were stained with Nestin (marker for type B cell), Mash1 (marker for type C cell), and DCX (marker for type A cell). (C) Quantification of the percentage of type B, C, and A cells with CRBP1 or HMGA1 in the SVZ. Statistical significance of differences between the groups was evaluated by independent sample t tests. All the analyses were carried out with SPSS software, and all values are given as mean ± SEM. A p-value <0.05 was considered statistically significant. (D,E) Representative images of CRBP1 + GFAP+ and HMGA1 + GFAP+ cells. Hoechest33343 was used as a nuclear marker. Inset images were shown from magnified cells.
