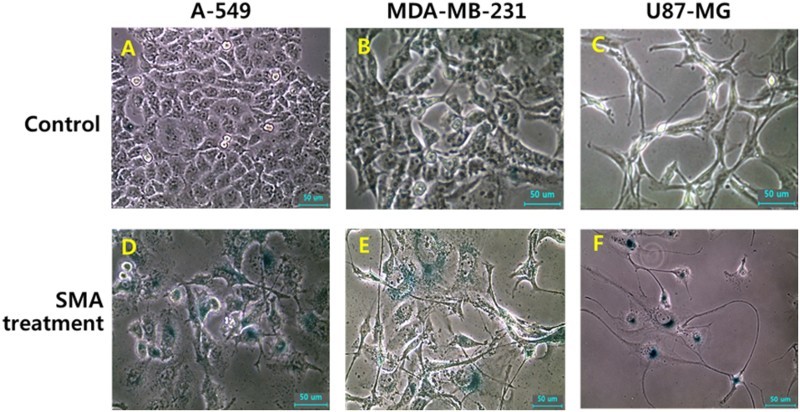
Figure 4.

Change in cell morphology and senescence-associated-β-galactosidase activity in untreated control (A, B and C) and 1 μM SMA-treated (D, E and F) A-549, MDA-MB-231 and U87-MG cancer cells A-549, MDA-MB-231 and U87-MG cancer cells up to 2 weeks (×100). Cell changes, such as enlarged and flattened size, and star-shape, were frequently observed by SMA treatment. And a higher activity of senescence-associated-β-galactosidase stained with blue color were observed in cells treated with SMA. Scale bars: 50 μm.
