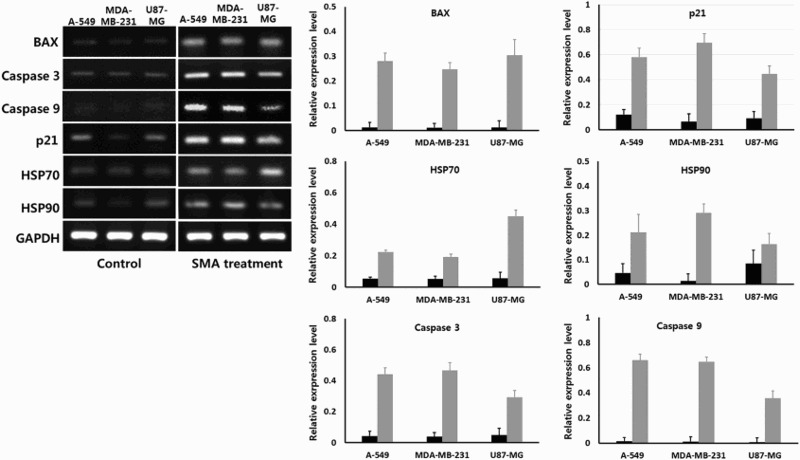
Figure 6.

Expression level of transcripts related with intrinsic apoptosis and stress by real-time RT-PCR in untreated control (▪) and 1 μM SMA-treated (▪) A-549, MDA-MB-231 and U87-MG cancer cells. Asterisks (*) indicates significant (P < .05) difference between untreated control and SMA-treated cell lines, respectively.
