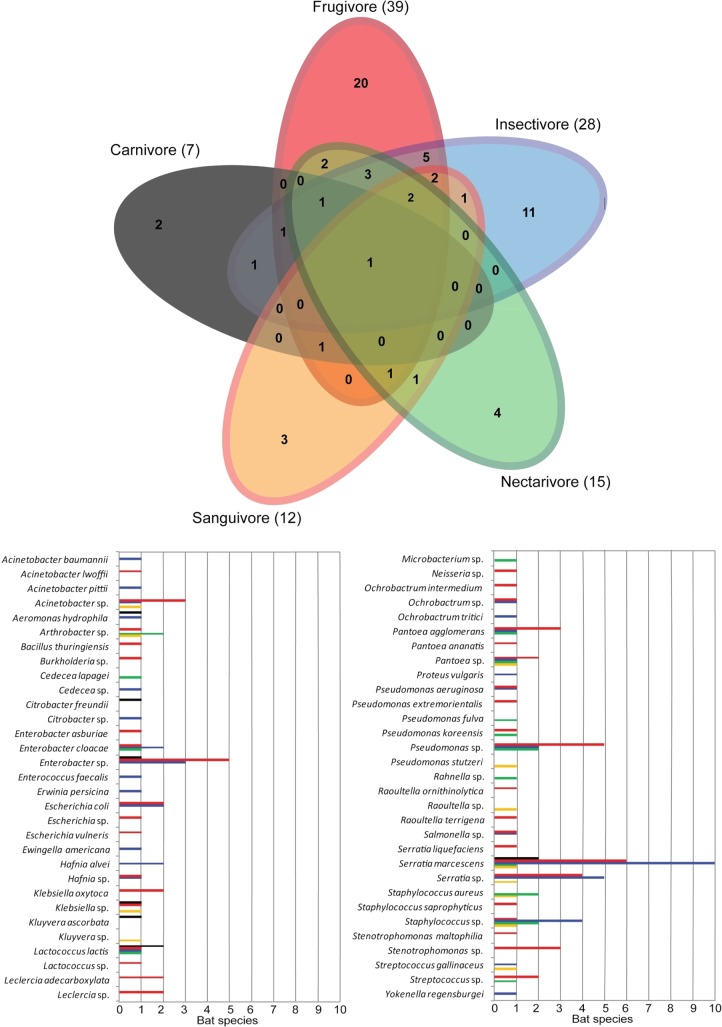
Fig 1. Venn-diagram showing the distribution of bacterial taxa from oral swabs of five dietary guilds of bats on Carlos Botelho State Park, São Paulo State.
The number of taxa within each guild is represented in parenthesis. The abundance of each taxa on bat species is presented in the graph, and separated by dietary guilds.

