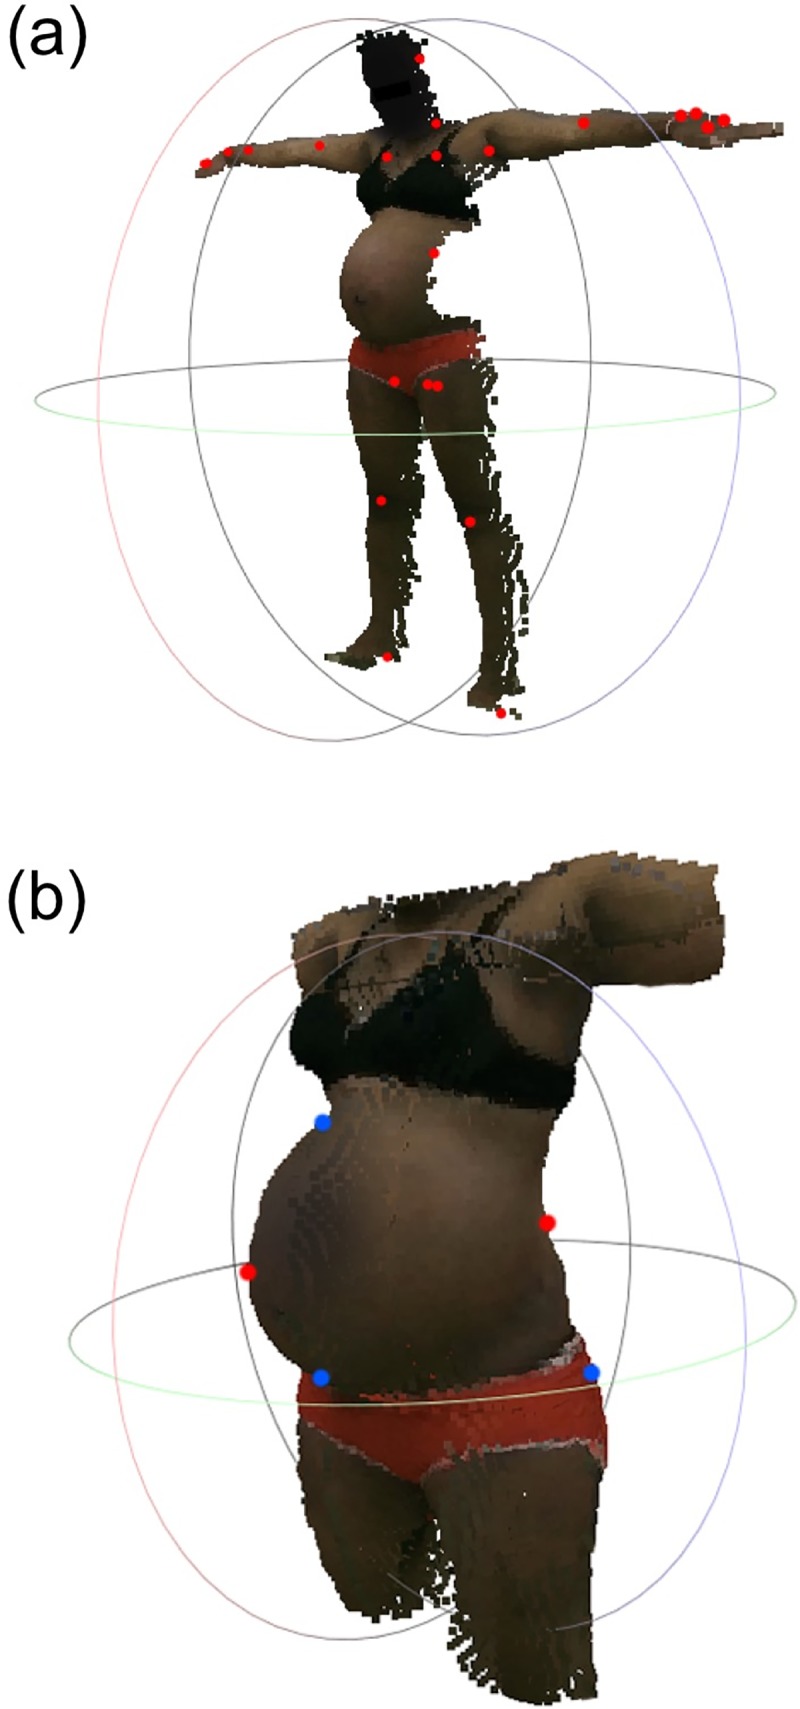
Fig 1. Illustrative kinect image and 3D reconstruction.

(a) Illustrative image, point cloud, and skeletal mapping overlay from an anterior view with joint locations from skeletal mapping shown as red dots. Note that the color of the face was darkened to protect the identity of the subject. (b) Illustration of the resulting three-dimensional model of the torso region obtained by stitching together the surface maps from four orthogonal views (anterior, left lateral, posterior, and right lateral). The red and blue dots represent the boundary points that were matched across adjacent scans.
