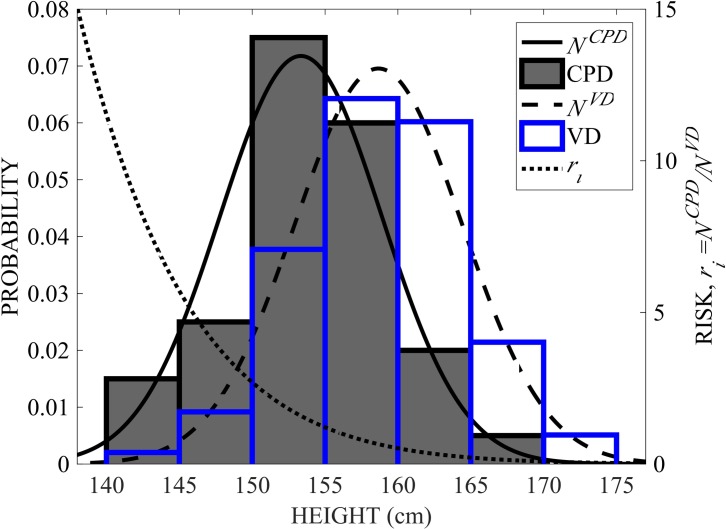
Fig 2. Illustrative risk model, ri.
Histograms and Gaussian distribution functions of feature fi = height for all CPD cases (shaded histogram bars and solid line NCPD) and all uncomplicated vaginal delivery cases (blue histogram bars and dashed line NVD) and from Eq (2)2 is shown in the dotted line. Note that the histograms and distribution functions refer to the vertical axis to the left and ri refers to the vertical axis to the right.

