
Fig 4. AUCbest, AUCadj and O versus number of features (k) included in the model.
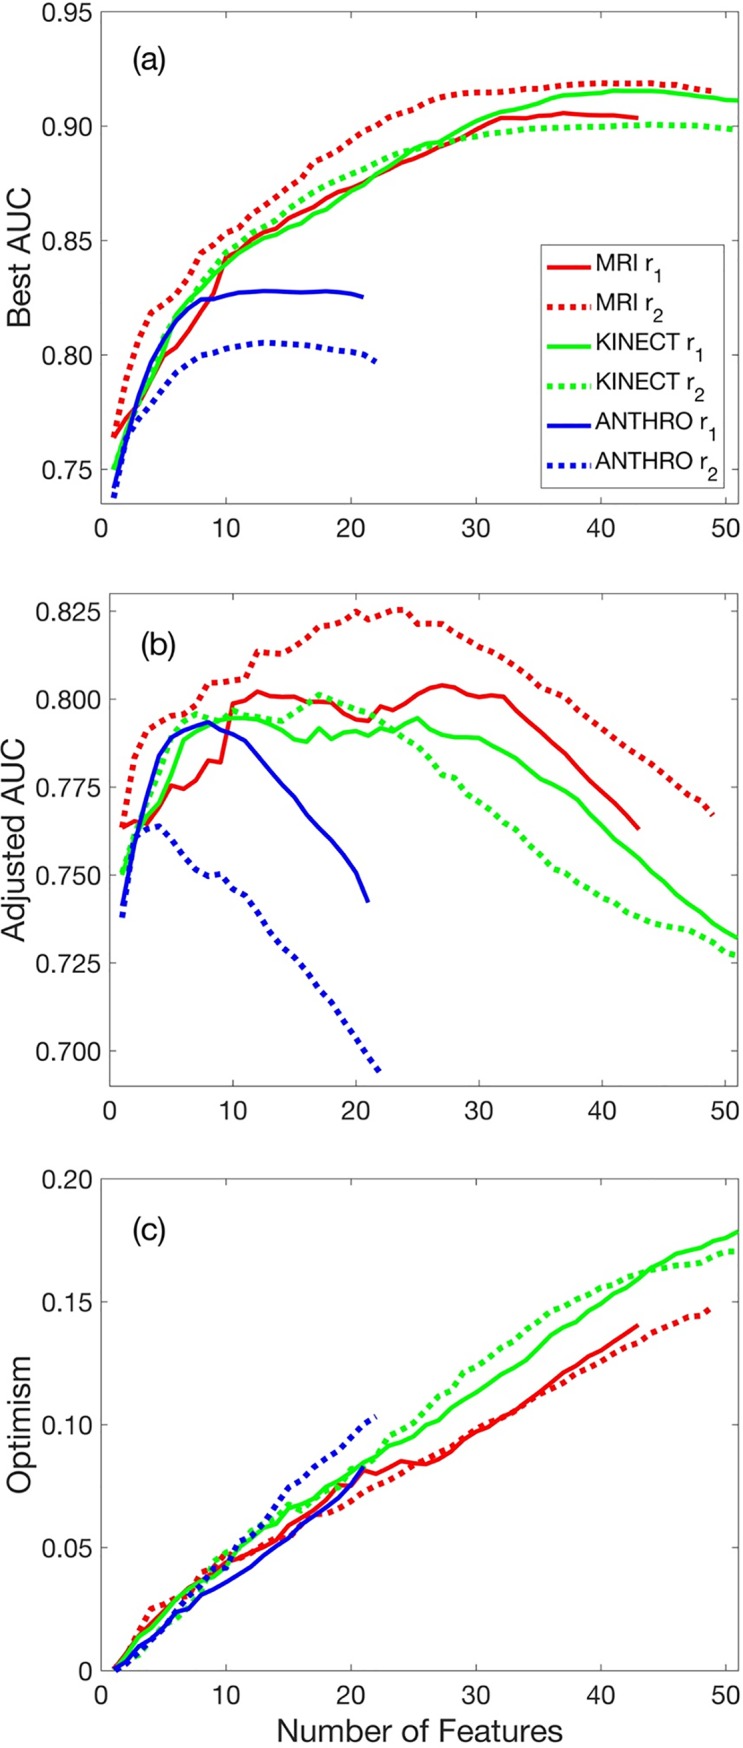
(a) AUCbest increases monotonically with increasing number of features. (b) AUCadj − k curves show that as the number of features included in the model increased, the AUCadj increased to reach a maximum value, plateaued in some cases, then decreased in models with a high number of features. (c) The optimism, O, increased linearly with an increasing number of features.