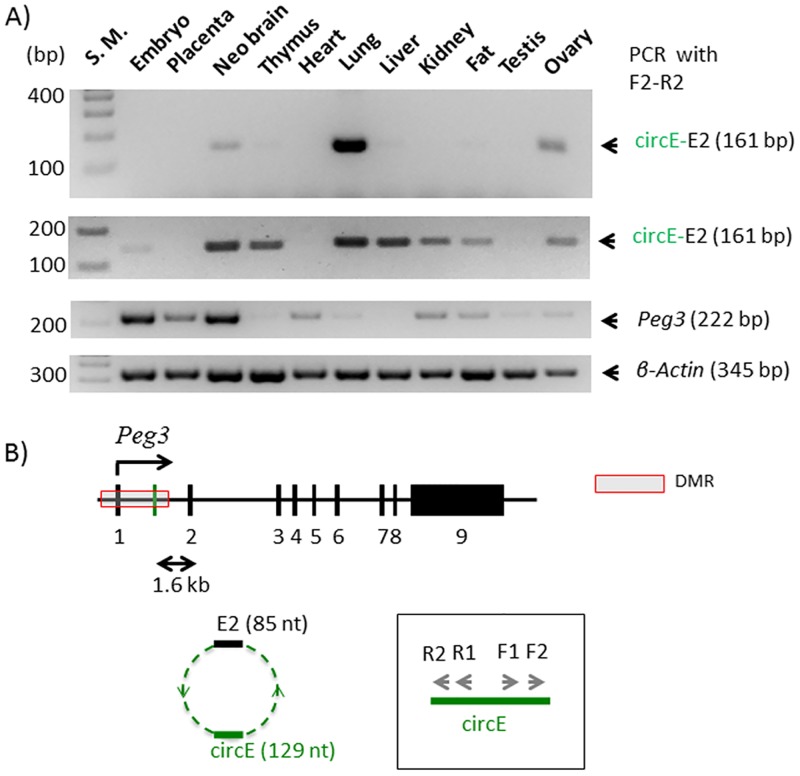
Fig 2. Circular RNA from the Peg3 locus, circPeg3.
(A) The two gel images on top represents the results of a nested PCR amplifying circPeg3 from two independent sets of cDNA that have been derived from the total RNA of various mouse tissues; the third image on middle shows the expression profile of Peg3; and the fourth image on bottom indicates the relative amount of cDNA between different tissues based on the expression levels of β-actin. (B) Schematic representation of the exon structure of the mouse Peg3 locus. The black vertical lines indicate individual exons and the green vertical line indicates the circE exon. The arrows within the box indicate the two sets of primers that have been used for a nested PCR scheme to amplify circPeg3.

