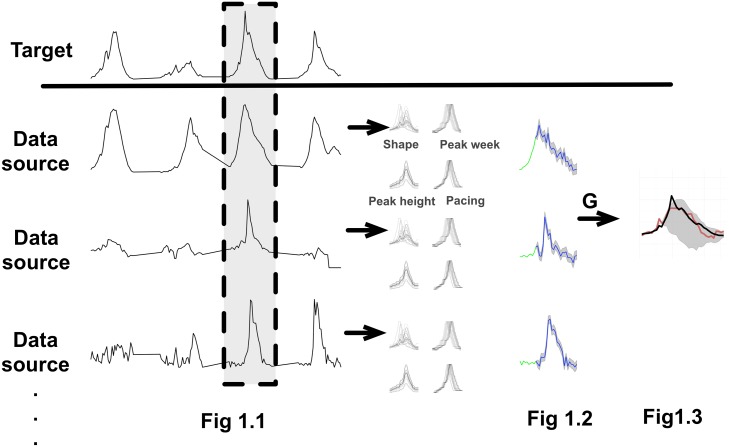
Fig 1. Multi-linear forecast of a historical influenza season.
When evaluating a candidate data source, we combine it with previously selected data sources and perform a series of leave-one-out forecasts. Each forecast involves three steps. (1) Align data and remove the focal season from all time series (gray band). (2) Make separate Bayes forecasts for each predictor, using the method introduced in [6] (green curves indicate observed weeks and blue curves indicate forecasts). The forecasts are derived from distributions of prototypical curves generated by perturbing and combining characteristics of historic seasons for each candidate data source (shape, pace, peak timing and peak height). (3) Integrate the predictor forecasts into a target forecast (red curve) using the multi-linear model g fit to the historical predictor and target data. We evaluate this approach by comparing our target forecasts with the true values of the focal season (black curve).

