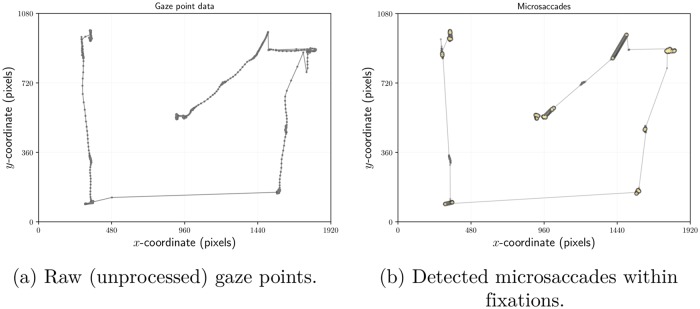
Fig 2. Illustration of microsaccade detection in a single participant’s gaze recording during calibration.
The small dots in (a) show gaze points prior to processing, i.e., detection of fixations or of microsaccades. Following processing, microsaccades in (b) are highlighted by larger, darker dots and thicker connecting segments. Notice that all small, raw gaze points that were not part of a fixation have now been removed. Thus any remaining small dots are members of fixation clusters that may or may not contain microsaccades. The point of this illustration is to show that microsaccades are detectable at locations far beyond the central fixation point. In the replication of Siegenthaler et al.’s [19] study, however, the participant’s gaze was held fixed at a central fixation point, hence the microsaccades depicted here during calibration were not used in the analysis of the experiment.

