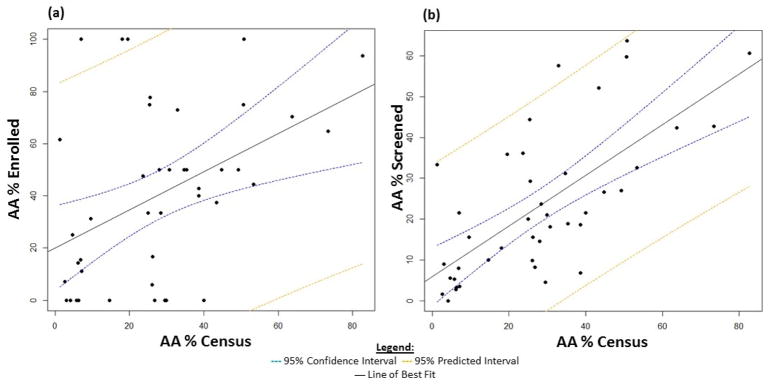
Figure 2.
a. AA enrollment by city (%) compared to AA census data (%) for each city. Cities with a higher percentage of AAs enrolled more AAs into the trial (p-value: 0.004, R2: 0.17). b. AA screening by city (%) compared to AA census data (%) for each city. Cities with a higher percentage of AAs screened more AAs into the trial (p-value: <0.001, R2: 0.46). 95% confidence interval indicates the likely location of the true population parameter, and 95% predicted interval forecasts where to expect the next data point sampled.

