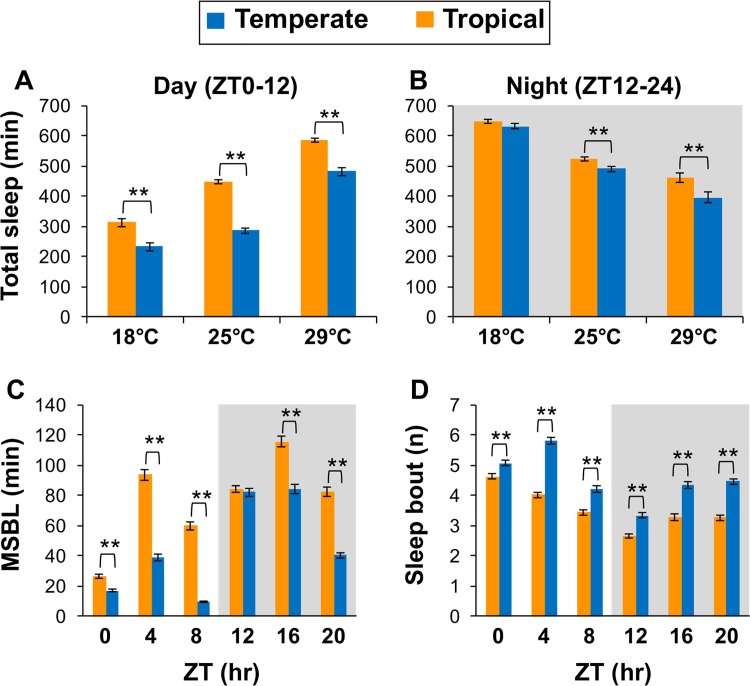
Fig 2. Daytime and nighttime sleep is more fragmented in temperate flies.
(A-D) The results are based on the same flies and activity data used in Fig 1. (A, B) Shown are group averages for total amount of sleep during 12 hr of day (A) and 12 hr of night (B), averaged over the last three days of LD. (C, D) Shown are group averages for median sleep bout length (MSBL) (C) and number of sleep bouts (D), during 4 hr time-windows. Values for tropical and temperate populations are significantly different using one-sided Student’s t-test; *, p < 0.05; **, p < 0.01. The following p values were determined; [panel A; 18°C, 0.0018; 25°C, <0.001; 29°C, <0.001], [panel B; 18°C, 0.33; 25°C, 0.0087; 29°C, 0.0017], [panel C; ZT0, 0.0011; ZT4, <0.001; ZT8, <0.001; ZT12, 0.38; ZT16, <0.001; ZT20, <0.001], [panel D; ZT0, 0.0031; ZT4, <0.001; ZT8, <0.001; ZT12, <0.001; ZT16, <0.001; ZT20, <0.001].

