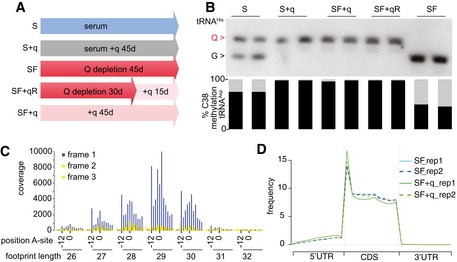
Figure 2. Q‐depleted and quantitatively modified cell culture conditions.

- Cell culture timing schedule.
- Corresponding queuosinylation and methylation levels, as determined by Northern blot using a tRNAHis probe and bisulfite sequencing of tRNAAsp GUC.
- Representative metaplot of SF cells. 25–32 mer ribosome footprint reads were summed across all annotated reading frames with the AUG staring codon at position zero. In‐frame 27–30 mer ribosome footprints showing the correct periodicity.
- Representative metagene plot of 27–30 mer ribosome footprints in S and SF culture conditions for two biological replicates (rep1 and rep2).
