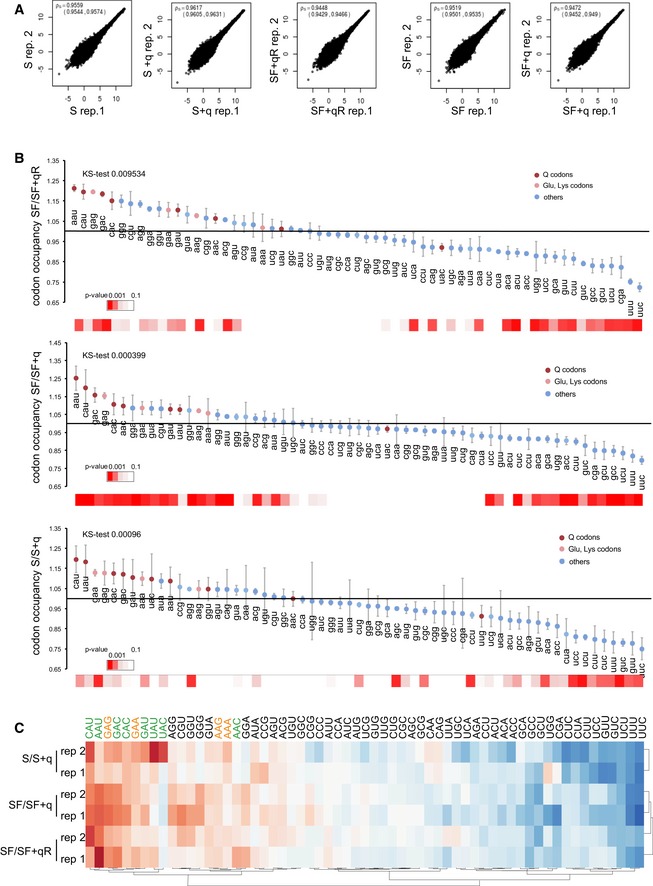
Figure EV2. Translation speed in Q‐free cells.

- Correlation between ribosome profiling dataset replicates. Spearman rho, 95% confidence interval for each pair of replicates.
- Changes in bulk codon occupancy in –Q cells compared to the relative rescue condition. All Q‐decoded codons and Glu/Lys codons are highlighted with the indicated colors. Error bars: ± SE of the permutated ratios of bulk codon occupancy for the indicated conditions; (n = 4). For each distribution, the statistical significance calculated using a Kolmogorov–Smirnov test is shown. P‐values (t‐test, adjusted for multiple testing) relative for each codon occupancy are indicated by a color scale heatmap at the bottom.
- The heatmap shows codon occupancy correlations between replicates using Ward's maximum distance clustering method. Q‐decoded codons are shown in green and Lys and Glu codons in orange. Note that hierarchical clustering grouped all Q‐decoded codons together.
