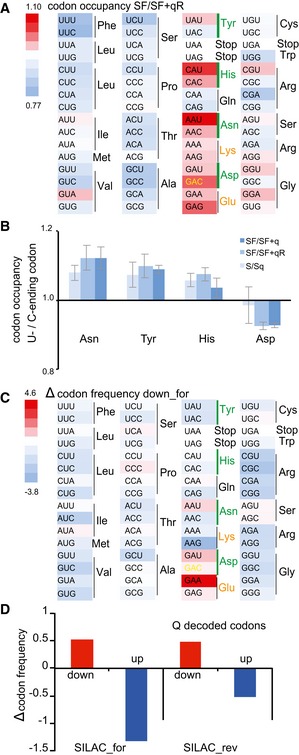
Figure 3. Effects of Q depletion on translational speed.

- Heatmap showing codon occupancy according to the color scale. Green bars indicate Q‐decoded codons. The Asp‐GAC codon translated by Q‐ and m5C38‐tRNAAsp GUC is shown in yellow and Lys and Glu codons are in orange. Lack of Q reduces ribosome translation speed at all Q‐dependent codons and at near‐cognate decoded codons.
- Translational speed of C‐ending codons relative to U‐ending codons. Error bars: ± SE of the permutated ratios of C‐ending codon occupancy relative to U for the indicated conditions; (n = 4).
- Heatmap displaying an increase or decrease in codon frequencies (‰) in SILAC down‐regulated proteins relative to the average frequency of that codon in unchanged proteins.
- Codons translated by Q‐tRNA are depleted in down‐regulated proteins and increased in up‐regulated proteins in both forward and reverse SILAC.
