
Figure EV3. SILAC.
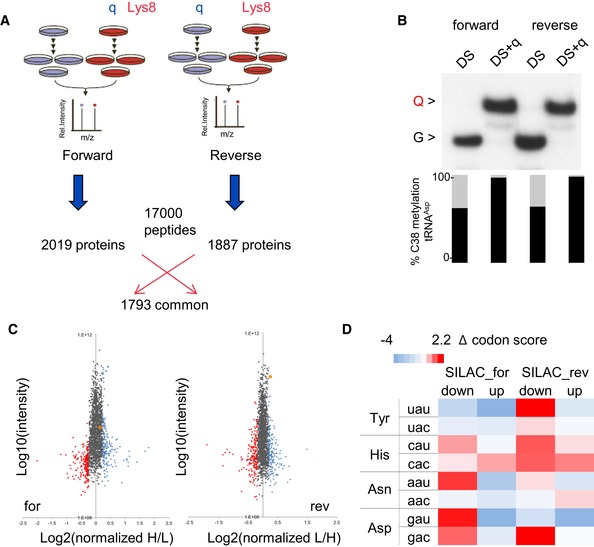
- Labeling culture conditions and numbers of identified proteins.
- APB Northern blot using tRNAHis probe and C38 methylation of tRNAAsp in SILAC labeled cells.
- SILAC analysis of deregulated proteins in the absence of Q. The top 10% of down‐regulated proteins are indicated in red, the top 10% of up‐regulated proteins are indicated in blue, HSPA5/BiP is indicated in orange.
- Increase or decrease in a codon frequency (‰) in up‐ or down‐regulated proteins relative to the average frequency of that codon in unchanged proteins is displayed as heatmap according to the color scale.