
Figure 4. Q‐dependent phenotypes in cultured cell lines.
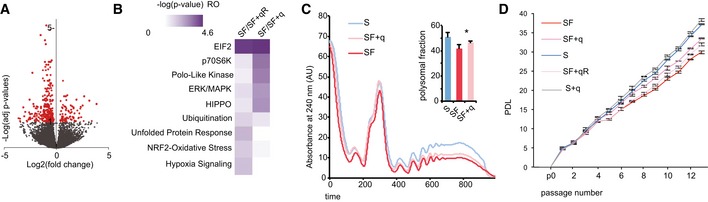
- The volcano plot shows differentially translated transcripts against adjusted P‐values for SF compared to SF + q. Red dots indicate P adj < 0.1 in multiple tests.
- Comparative analysis of differentially translated mRNAs of both experimental groups (SF compared to SF + q and SF compared to SF + qR) using ingenuity pathway analysis identified EIF2 signaling as the most significantly affected canonical pathway.
- Representative polysome profiles of HeLa cells grown in S and SF medium in the absence or presence of q. As a measurement for the global translation rate, the fraction of polysomal ribosomes was quantified; *P < 0.05 (t‐test); n = 5.
- Proliferation analysis of HeLa cells grown under the indicated culture conditions. Population doubling levels of three biological replicates were calculated for each time point. Error bars: ± SD; n = 3.