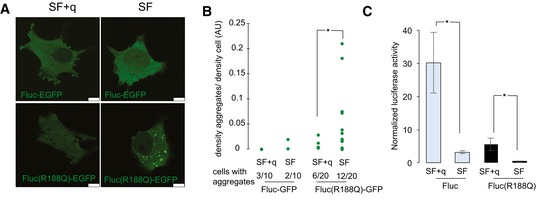
Figure 5. Translational stress results in unfolded proteins.

- Representative fluorescence confocal images of live HeLa cells expressing Fluc‐EGFP and FlucR188Q‐EGFP maintained in SF compared to SF + q. Scale bars, 10 μm.
- Fluorescence intensity of aggregates was quantified as a fraction of fluorescence of the entire cell. The number of cells showing at least one aggregate is indicated. Ten cells were imaged for Fluc‐EGFP and 20 cells for FlucR188Q‐EGFP from three independent transfections; *P < 0.05 (t‐test).
- Specific luminescence activity of EGFP‐tagged sensor proteins maintained in SF compared to SF + q. Luciferase activity was normalized to the luciferase protein content in the sample. Error bars: ± SD; *P < 0.05 (t‐test); n = 8.
