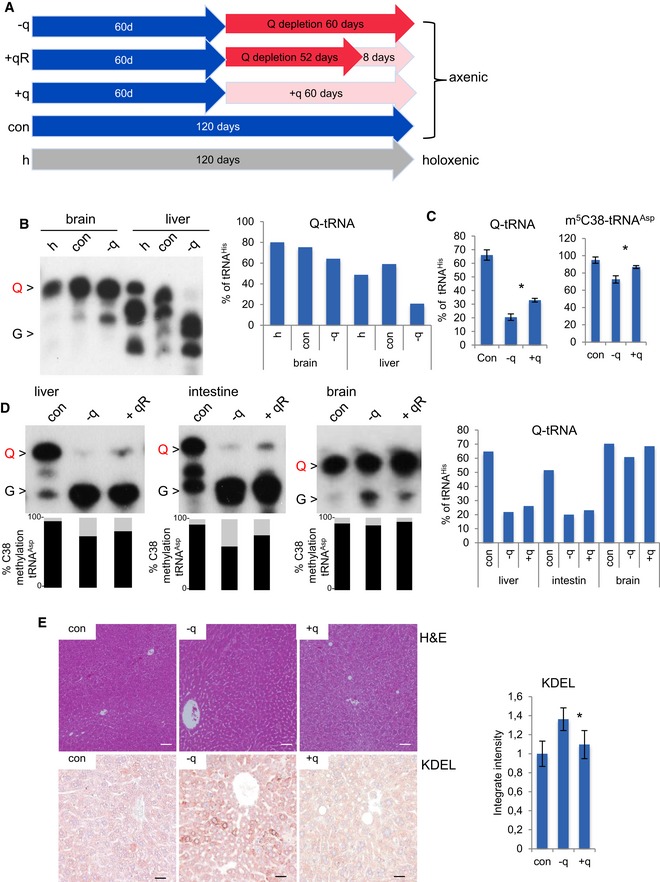
Figure EV5. Q‐dependent phenotypes in Q‐deficient mice.

- Mouse feeding timing schedule.
- APB Northern blot using tRNAHis probe indicates that liver and brain axenic mouse tissues show physiological levels of Q‐tRNA and that q‐free diet depletes Q‐tRNA. Q‐tRNA level is obtained by quantification of Q and G signals and is presented on the right graph.
- Liver C38 methylation of tRNAAsp and Q‐tRNA percentage obtained by quantification of the Q and G signals in Fig 7A. Error bars: ± SD; (n = 3).
- APB Northern blot using tRNAHis probe shows that q‐free diet depletes Q‐tRNA. m5C38 state measured by 454 bisulfite sequencing in the same RNA. Both queuosinylation and methylation levels could be slightly restored by the addition of q to the diet for 8 days. Q‐tRNA percentage is obtained by quantification of the Q and G signals.
- The upper panels show liver sections from indicated mice stained with hematoxylin and eosin, whereas the lower panels show an overview of the immunostaining with antibodies against KDEL. Scale bar 50 μm. Automated quantification of KDEL intensity. Error bars: ± SD; *P < 0.05 (t‐test); n ≥ 3 optical fields; for three mice for condition.
