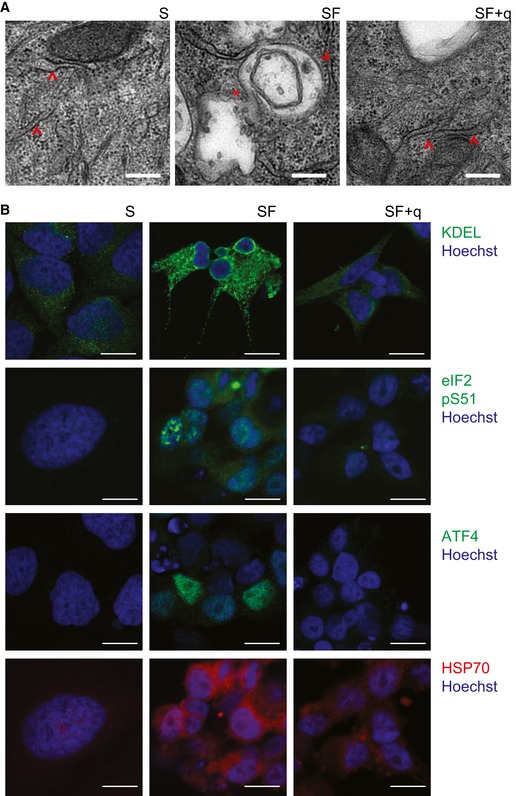
Figure 6. ER stress and UPR response upon Q depletion.

- Transmission electron microscopy images showing the increase in cystic ER vacuole upon q depletion. Arrowheads indicate rough endoplasmic reticulum while expansions are indicated by asterisks. Scale bar 250 nm.
- Representative images showing immunofluorescence of HeLa cells grown in S and SF medium in the absence or presence of q. Anti‐KDEL (ER stress marker), anti‐eIF2‐pS51 (ER stress‐induced inhibitor of translation), anti‐ATF4 (transcription factor that activates ER stress‐responsive genes), and anti‐Hps70 (chaperone). Nuclei were stained with Hoechst. Scale bar 10 μm.
