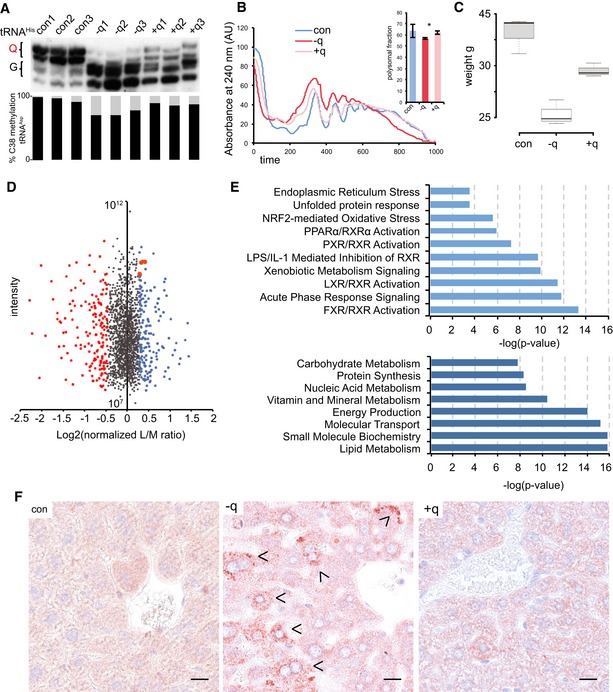
APB Northern blot using a tRNAHis probe. m5C38 levels were determined by 454 bisulfite sequencing of RNA from the same liver tissue. Both queuosinylation and methylation levels could be restored by the addition of q to the feed. The results are shown for three biological replicates.
Representative polysome profiles showing a reduction in the protein translation rate in the liver of axenic mice fed with a q‐free synthetic diet. Addition of q to the q‐free diet significantly rescued the translation rate. n = 3. Asterisks indicate statistically significant (P < 0.05, t‐test) differences.
Box plot showing the body weight of mice fed a q‐free synthetic diet for 60 days, center lines show the medians; box limits indicate the 25th and 75th percentiles, whiskers extend 1.5 times the interquartile range; n = 3. Addition of q to the q‐free diet significantly rescued body weights.
Dimethyl‐labeling analysis of −q versus +q liver tissue. Top 10% of deregulated proteins are indicated in red and blue. UPR effectors: HSPA5/BiP, HSP90b1, and CALR are in orange.
Gene ontology analysis of deregulated proteins. Signaling pathways and biological functions are presented
Liver sections from indicated mice were stained with anti‐KDEL antibody. Arrowheads indicate ER‐stressed hepatocytes. Scale bar 25 μm.
Data information: con (
n = 3) mice were fed with conventional sterilized food, −q (
n = 3) mice were fed with a q‐free synthetic diet for 60 days, and +q (
n = 3) mice were fed with the same synthetic diet supplemented with 40 nM queuine for 60 days.
Source data are available online for this figure.

