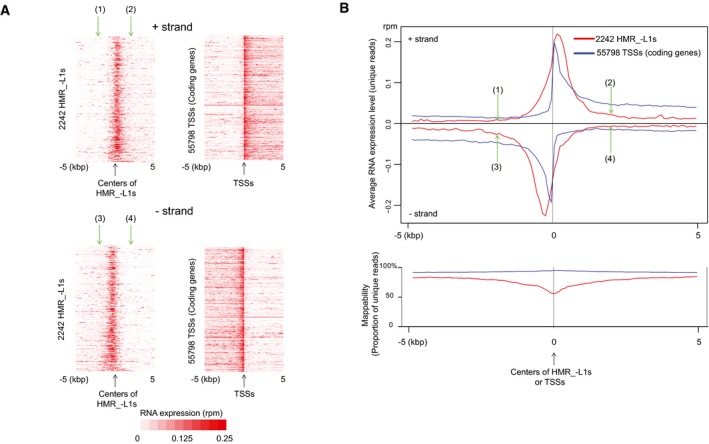
HMRs express RNAs. Heatmaps (A) and metaplots (B) show RNA expression levels in 16.5 dpc prospermatogonia. Only uniquely mapped RNA‐seq reads were used for the analyses. Positions (1)–(4) in (A and B) (green arrows) indicate the same positions (±2 kb from the centers). The lower chart in (B) represents mappability defined as the percentage of unique sequences in all possible 50‐nt sequences (see
Appendix Fig S2B). TSS isoforms are included in 55,798 TSSs. Low mappability at the centers of HMR_−L1s is due to high occurrence of repeat (retrotransposon) sequences. RPM, reads per million mapped reads.

