
Figure EV1. Statistics for bisulfite sequencing.
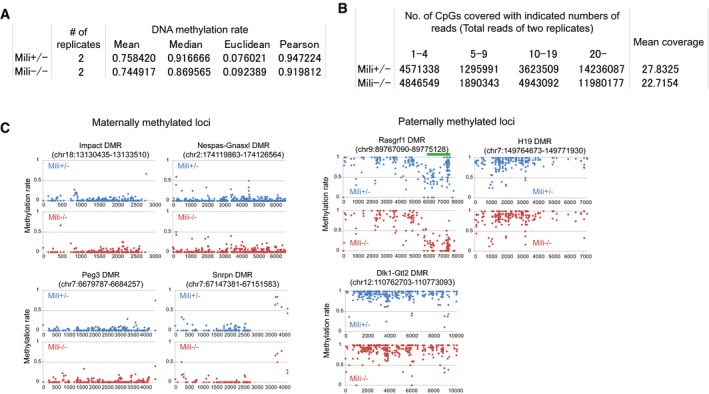
- Statistics for the CpG methylation rate. Pearson correlation and mean Euclidean distance between CpG methylation rates of two biological replicates are shown. Only CpG sites covered with more than 10 mapped reads in both replicates were considered for the analyses. Of 12406548 (Mili +/−) and 8228713 (Mili −/−) CpG sites that were considered for the analyses, 7,650,754 CpG sites were common between Mili +/− and Mili −/−.
- Genomic coverage of bisulfite sequencing. Total read numbers of both biological replicates were used for this analysis. For mean coverage, only CpGs covered with at least one unique sequence read were considered.
- DNA methylation pattern of maternally and paternally methylated loci. Hypomethylated region identified in the Rasgrf1 differentially methylated region (DMR) is indicated by green bar.