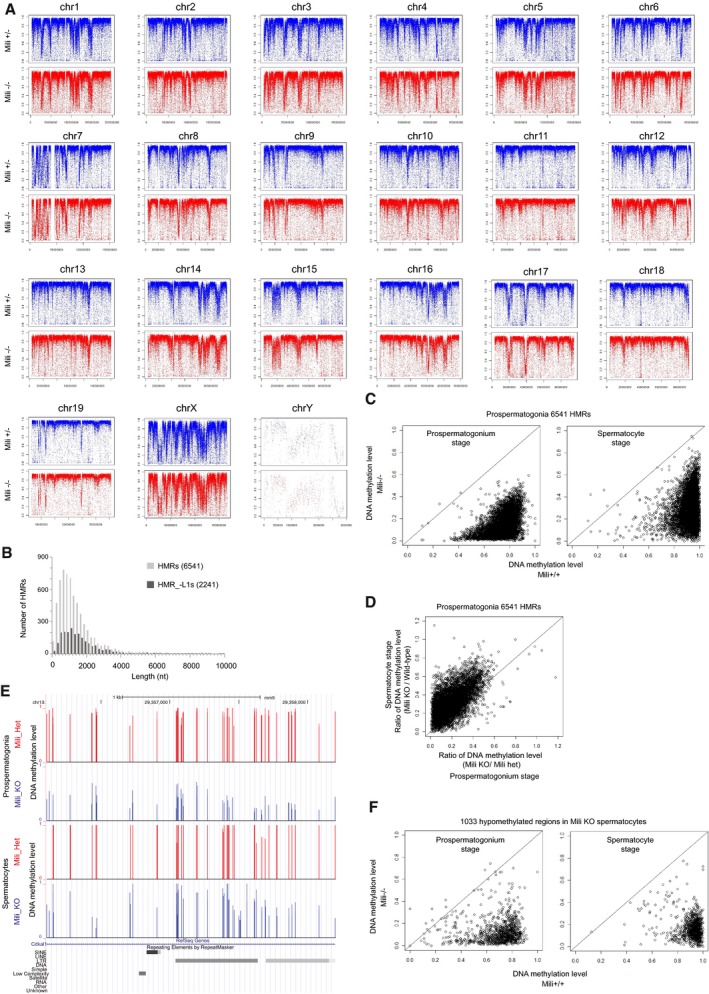
Figure EV2. Features of hypomethylated regions identified in Mili −/− prospermatogonia (HMRs).

- DNA methylation pattern is not changed in Mili −/− prospermatogonia at chromosome levels. Average CpG DNA methylation levels (2‐kb window) are plotted on each chromosome.
- Length distribution of hypomethylated regions in Mili −/− prospermatogonia (HMRs). The numbers in parentheses represent the numbers of regions examined.
- Most HMRs are kept hypomethylated in Mili −/− spermatocytes. Circles in the charts show 6,541 HMRs. X‐axis (Y‐axis) represents average DNA methylation level in Mili −/− (control) mice. The results in prospermatogonia (top) and spermatocytes (bottom) are shown.
- DNA methylation of HMRs seems to be more severely affected in prospermatogonia compared with spermatocytes. X‐axis (Y‐axis) represents ratio of DNA methylation level between Mili KO and control mice in prospermatogonia (spermatocytes).
- A representative genomic locus that shows clear difference in DNA methylation level between Mili mutant and control mice in prospermatogonia compared with spermatocytes.
- Most hypomethylated regions in Mili KO spermatocyte are also hypomethylated in prospermatogonia. See (D) for information about the chart.
