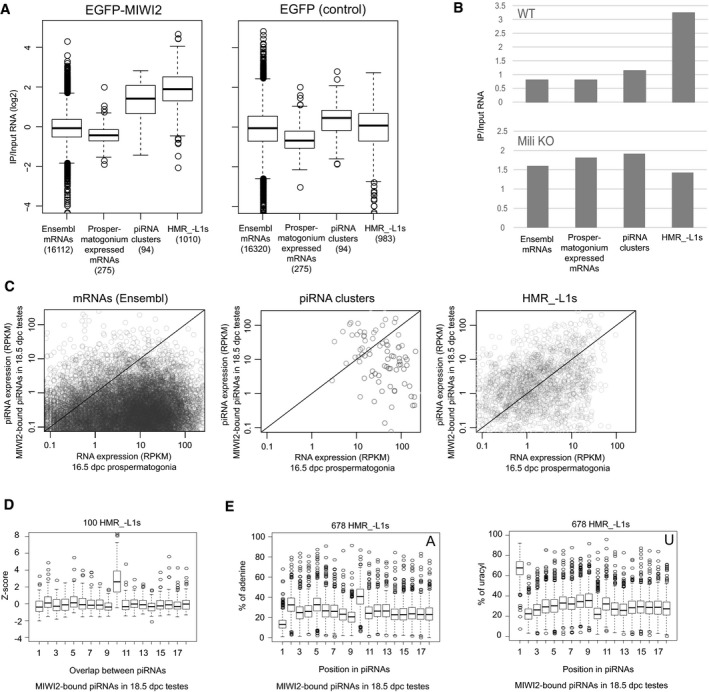
RNA immunoprecipitation (RIP) analyses of EGFP‐MIWI2 and EGFP. EGFP‐MIWI2 and EGFP were immunoprecipitated from 16.5 dpc prospermatogonia, and long RNAs bound to these proteins and input RNAs were sequenced. RNAs expressed from HMR_−L1s and piRNA clusters, but not Ensembl and prospermatogonium‐expressed mRNAs, are overall enriched by immunoprecipitation (IP) of EGFP‐MIWI2 (left). This enrichment is not observed when EGFP is immunoprecipitated (right). The numbers of mRNAs, piRNA clusters, and HMR_−L1s analyzed were shown in parentheses. Prospermatogonium‐expressed mRNAs are those that are highly and specifically expressed in prospermatogonia. The bottom and top of boxes represent 25% percentile and 75% percentile, respectively. The line in the box represents the median. Circles represent outliers, and the bottom (top) of whiskers represents the minimum (maximum) values except for outliers.
RIP analyses of EGFP‐MIWI2 in newborn testes from WT and Mili KO mice. RNA bound to EGFP‐MIWI2 and input RNA was sequenced. All RNAs derived from each class was counted for this analysis.
HMR_−L1s preferentially generate piRNAs. X‐ and Y‐axes represent expression levels of long RNAs (16.5 dpc prospermatogonia) as determined by RNA‐seq and MIWI2‐bound piRNAs (18.5 dpc testes) as determined by small RNA‐seq, respectively. Circles in the charts represent individual mRNAs, piRNA clusters, and HMR_−L1s. More than half of the HMR_−L1s (right) are located in the area of y > x (upper part of the diagonal), whereas most mRNAs (left) are located in the area of y < x (lower part of the diagonal). RPKM, reads per kilobase per million mapped reads.
Frequent 10‐nt overlap between sense and antisense piRNAs derived from HMR_−L1s. Top 100 HMR_−L1s that generate the largest number of unique piRNAs were analyzed. Frequencies of 1‐ to 18‐nt overlaps were analyzed for each HMR_−L1.
piRNAs derived from HMR_−L1s are enriched in adenine at their 10th nucleotide. HMR_−L1s generating more than 40 unique piRNAs were analyzed (678 HMR_−L1s). The proportions of piRNAs with adenine (left) and uridine (right) at the indicated positions were analyzed for each HMR_−L1. See (A) for the explanation of box plots.

