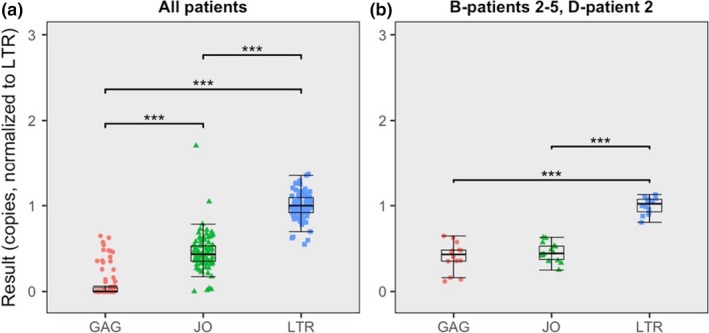
Figure 2.

Boxplots depicting patient isolate quantifications results.
(a) All patient isolates combined. (b) Only GAG‐detectable patient isolates B‐patient 2, B‐patient 3, B‐patient 3, B‐patient 4, B‐patient 5 and D‐patient 2.

Boxplots depicting patient isolate quantifications results.
(a) All patient isolates combined. (b) Only GAG‐detectable patient isolates B‐patient 2, B‐patient 3, B‐patient 3, B‐patient 4, B‐patient 5 and D‐patient 2.