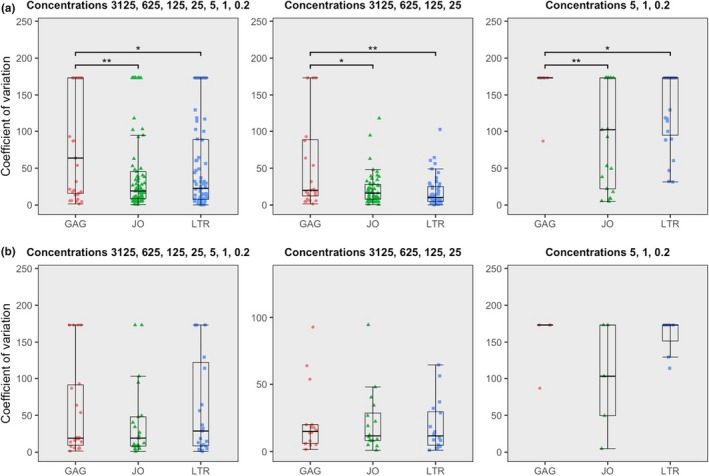
Figure 3.

Boxplots showing the coefficient of variation (CV) for the subtype plasmids, either all input concentrations combined, grouped for the highest input or grouped for the lowest input.
(a) All subtype plasmid results combined. (b) Only CVs of subtype plasmids B‐clone 1, B‐clone 2, D‐clone 2 and the G‐clone.
