
Figure 2. Charme regulates myogenesis by interacting with the nctc region.
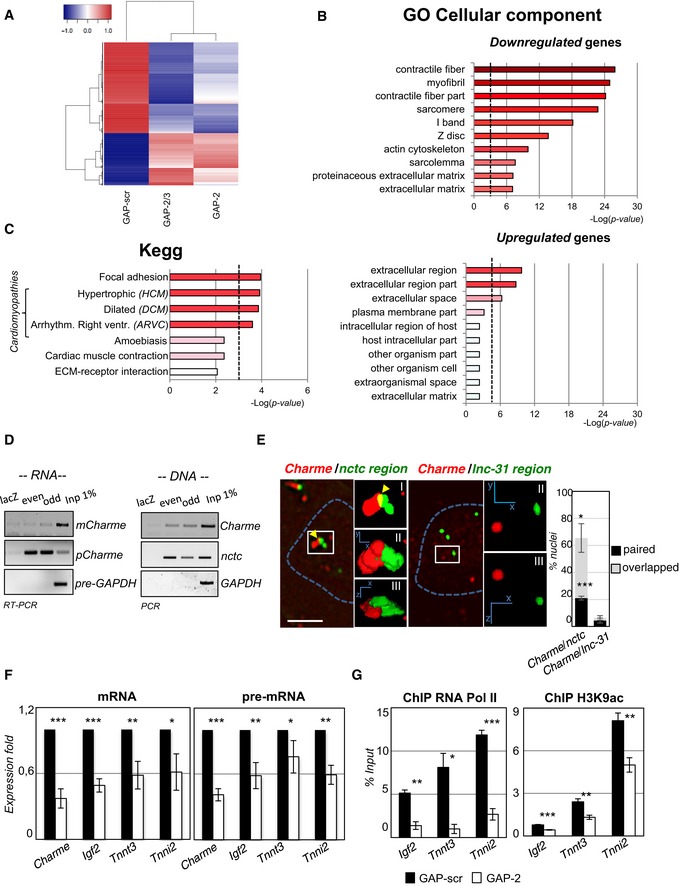
- RNA‐seq analysis of transcriptome changes upon Charme depletion. Heatmap was drawn using the heatmap3 R package and represents hierarchical clustering of the common genes differentially expressed upon Charme depletion with both GAP‐2 and GAP‐2/3 GAPmers, compared to GAP‐scr control. The expression levels correspond to mean‐centered log2‐transformed FPKM values. See also Table EV1.
- Gene Ontology (GO) term enrichment analyses performed by FIDEA (D'Andrea et al, 2013) on genes downregulated (top) or upregulated (bottom) upon Charme depletion. Bars indicate the top 10 categories of cellular components in decreasing order of significance. Threshold (P‐value < 0.01) is indicated by the dashed black line.
- KEGG pathway enrichment analysis on genes downregulated by Charme depletion.
- Quantification of recovered RNA (left) and DNA (right) upon Charme ChIRP with the pool of biotinylated probes reported in Table EV4.
- RNA/DNA FISH for Charme RNA and nctc (left) or lnc‐31 (right) loci in 2‐day differentiated myotubes. Inserts show a magnification of the spots converted into binary images (I), 3D rendering (II), or rotated on Z‐axis (III). Yellow arrows indicate signals overlapping. Right histogram reports the mean ± SD percentage of nuclei with paired or overlapped spots from two biological replicates. Scale bar = 5 μm.
- qRT–PCR quantification of Charme and Charme target genes in GAP‐scr‐ vs. GAP‐2‐transfected (2‐day differentiated) myotubes. PCR data were normalized to GAPDH and represent mean ± SD of triplicates.
- RNA Pol II (left) and H3K9ac (right) ChIP performed in GAP‐scr‐ vs. GAP‐2‐transfected myotubes. The recovered chromatin was analyzed by qPCR in parallel with an intergenic region used to normalize the two (GAP‐scr vs. GAP‐2) conditions. Data were subtracted for background and are expressed as input percentage (% Input). Histograms represent the mean ± SEM of three biological replicates.