
Figure EV2. Chromatin contacts and functional characterization of the murine Charme transcript.
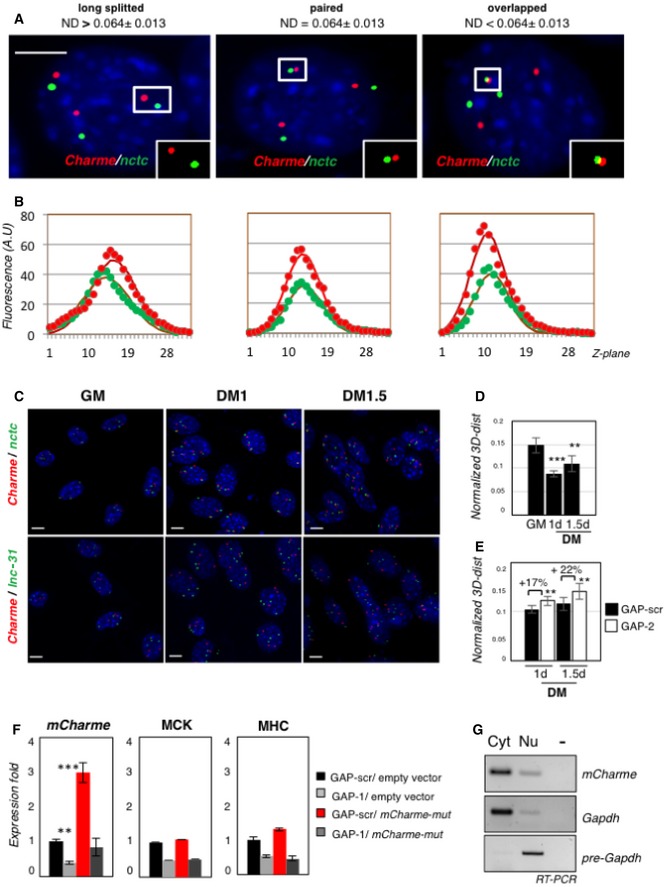
- Examples of proximal Charme/nctc DNA FISH spots on the same Z‐section. Red and green signals correspond to Charme or nctc chromatin regions, respectively. White boxes show binarized images of single focal planes containing long‐splitted, paired, or overlapped patterns. On top of the panels, the 3D interallelic distance interval (ND) for each category is shown. ND values were obtained by normalization to the diameter of the nuclei. The number of green/red DNA spots per nucleus (n = 3) reflects the C2C12 aneuploidy with three copies of chromosome 7. Scale bar = 5 μm.
- Plotting of Z‐stack intensity distribution for each spot in the insets of (A). Gaussian fit curve (full line) for the data of fluorescence intensity (filled circles) in each channel is plotted along Z‐planes (Z‐step = 200 nm). The strong correspondence of green and red channel distribution indicates near co‐localization and co‐planarity of the signals.
- Full field view of the DNA FISH studies on the nuclear distribution of Charme and nctc (top) or Charme and lnc‐31 (bottom) loci. Scale bar = 5 μm.
- Normalized 3D distances between Charme and nctc loci at the indicated time points (GM, DM 1–1.5 days). Interallelic distances were normalized to nuclei diameter.
- Normalized 3D distances between Charme and nctc loci in GAP‐scr or GAP‐2 treated cells at the indicated differentiation times (DM 1–1.5 days). Interallelic distances were normalized to nuclei diameter. Mean ± SD ND values are shown. **P < 0.01, ***P < 0.001, unpaired Student's t‐test.
- Quantitative real‐time RT–PCR analyses of mCharme, MHC, and MCK mRNAs in C2C12 cells transfected with GAP‐scr or GAP‐1 in combination with a mCharme mutant (mCharme‐mut) in the GAP‐1 targeting site. Transfections with the empty vector were used as negative control. PCR data were normalized to GAPDH mRNA.
- sqRT–PCR quantification of mCharme in cytoplasmic (Cyt) and nuclear (Nu) fractions from C2C12 cells transfected with mCharme‐mut. The quality of fractionation was tested with mature (GAPDH) and precursor (pre‐GAPDH) RNAs. −, RT‐minus control.
Source data are available online for this figure.