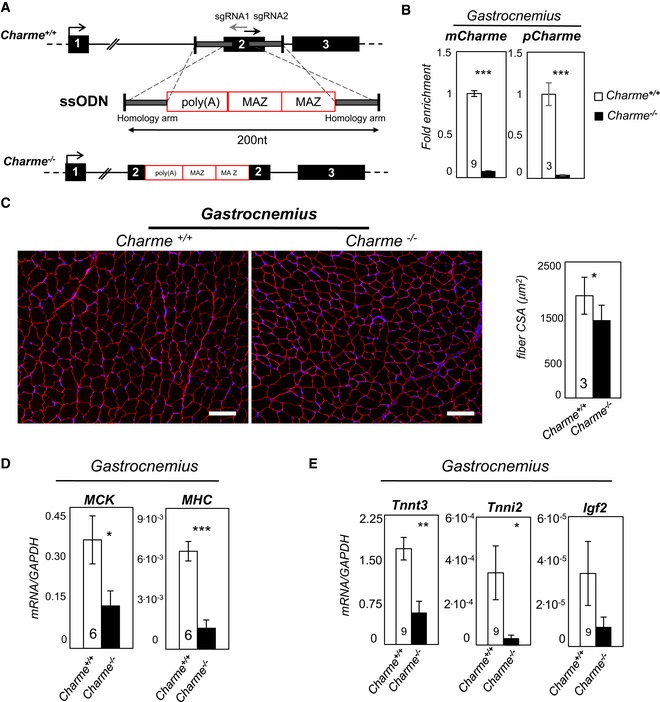
Top: Charme locus is shown together with the position of sgRNA1 and sgRNA2 divergent single guides. Bottom: design of the single‐stranded oligodeoxynucleotide (ssODN) containing the two homology arms (gray line) and the 100‐nt‐long poly(A)/2×MAZ cassette.
qRT–PCR quantification of mCharme and pCharme expression in skeletal homogenates from Charme
+/+ and Charme
−/− mice. The number of mice tested is the same for the two groups, and it is indicated in the white bars. Data were normalized to GAPDH mRNA and represent mean ± SEM.
Dystrophin staining analyzed by immunofluorescence on Charme
+/+ and Charme
−/− skeletal (gastrocnemius) biopsies. The mean ± SD of cross‐sectional area (μm2) is reported in the histograms besides. In total, N = 667 and 1,039 fibers per condition were analyzed. Original magnification = ×10. The number of mice tested is the same for the two groups, and it is indicated in the white bars. Scale bar = 100 μm.
qRT–PCR quantification of MHC and MCK transcripts in skeletal (gastrocnemius) homogenates from Charme
+/+ and Charme
−/− mice. The number of mice tested is the same for the two groups, and it is indicated in the white bars. Data were normalized to GAPDH mRNA and represent mean ± SEM.
qRT–PCR quantification of Tnnt3, Tnni2, and Igf2 transcripts in skeletal (gastrocnemius) homogenates from Charme
+/+ and Charme
−/− mice. Data were normalized to GAPDH mRNA and represent mean ± SEM. The number of mice tested is the same for the two groups, and it is indicated in the white bars.
‐test.