
Figure EV4. Genomic features and expression analysis of the human Charme locus.
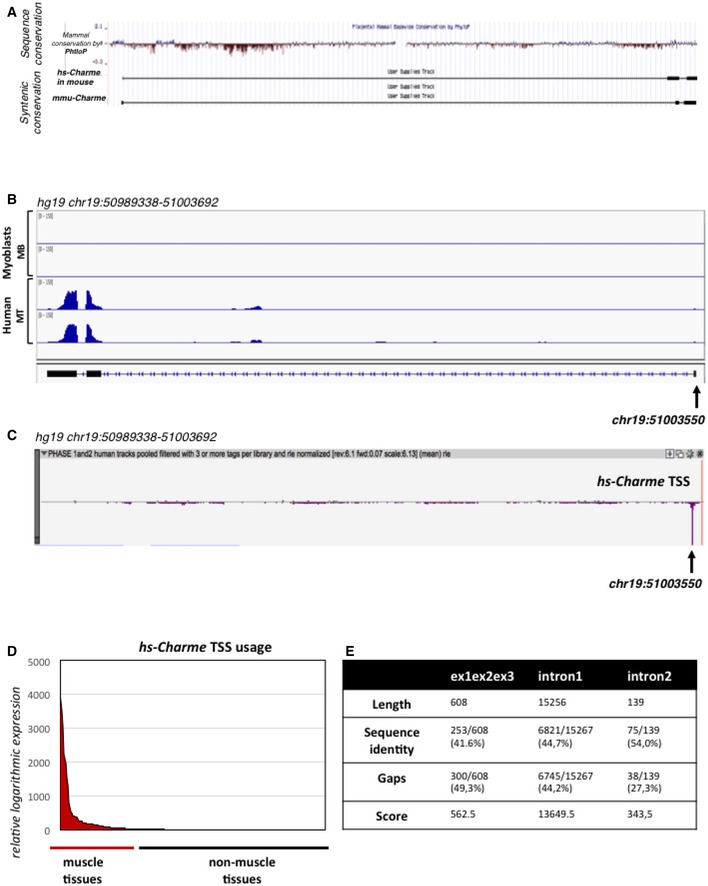
- UCSC visualization of the merged between human (hg19, top) and mouse (mm9, bottom) Charme genomic coordinates in the mm9 mouse genome. The analysis shows the mammal genomic sequence conservation (PhyloP) and the Charme transcript synteny between mouse and human.
- IGV (Robinson et al, 2011; Thorvaldsdóttir et al, 2013) visualization of the reads coverage from a RNA‐seq experiment performed in human myoblasts (Legnini et al, 2017; GSE70389) in proliferating (MB) and differentiating (MT) conditions; the arrow shows the TSS coordinate. The aligned reads were assembled into the transcript whose exon/intron structure is shown below.
- Zenbu (Severin et al, 2014) visualization of the hs‐Charme TSS peak from FANTOM5 (Phase 1 and 2) CAGE datasets across 1,829 samples; the arrow shows the TSS coordinate which corresponds to the one identified by RNA‐seq as reported in (B). The genomic coordinates are reported below.
- The diagram shows the hs‐Charme expression in muscle vs. non‐muscle tissues. The entire dataset was exported from FANTOM5 (Phase 1 and 2) CAGE datasets across 1,829 samples (see also Table EV3, sheet 1).
- Table represents the values obtained by analyzing the local sequence alignment between the human and murine Charme transcripts. Data were produced by using the implementation of the Smith–Waterman algorithm available at http://www.ebi.ac.uk/Tools/psa/emboss_water/. See also Table EV4.