
Figure 1. Identification of novel REV7 interactors relevant for the NHEJ pathway.
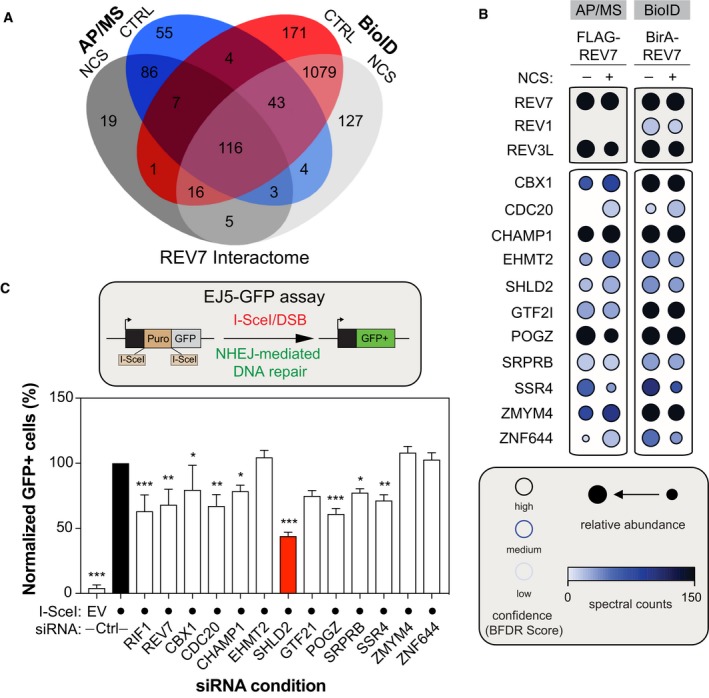
- Venn Diagram representing the distribution of proteins identified by both the BioID and the standard AP/MS of REV7, with or without DNA damage (NCS).
- Selected BioID REV7 results, shown as dot plots. The spectral counts for each indicated prey protein are shown as AvgSpec. Proteins were selected based on and iProphet probability of > 0.95, BFDR of < 0.05, and ≥ 10 peptide count. The circle size represents the relative abundance of preys over baits.
- U2OS EJ5‐GFP cells were transfected with the indicated siRNAs. At 24 h post‐transfection, cells were transfected with the I‐SceI expression plasmid, and the GFP+ population was analyzed 48‐h post‐plasmid transfection. The percentage of GFP+ cells was determined for each individual condition and subsequently normalized to the non‐targeting condition (siCTRL). Data are presented as the mean ± SD (n = 3). Significance was determined by one‐way ANOVA followed by a Dunnett's test. *P < 0.05, **P < 0.005, ***P < 0.0005.